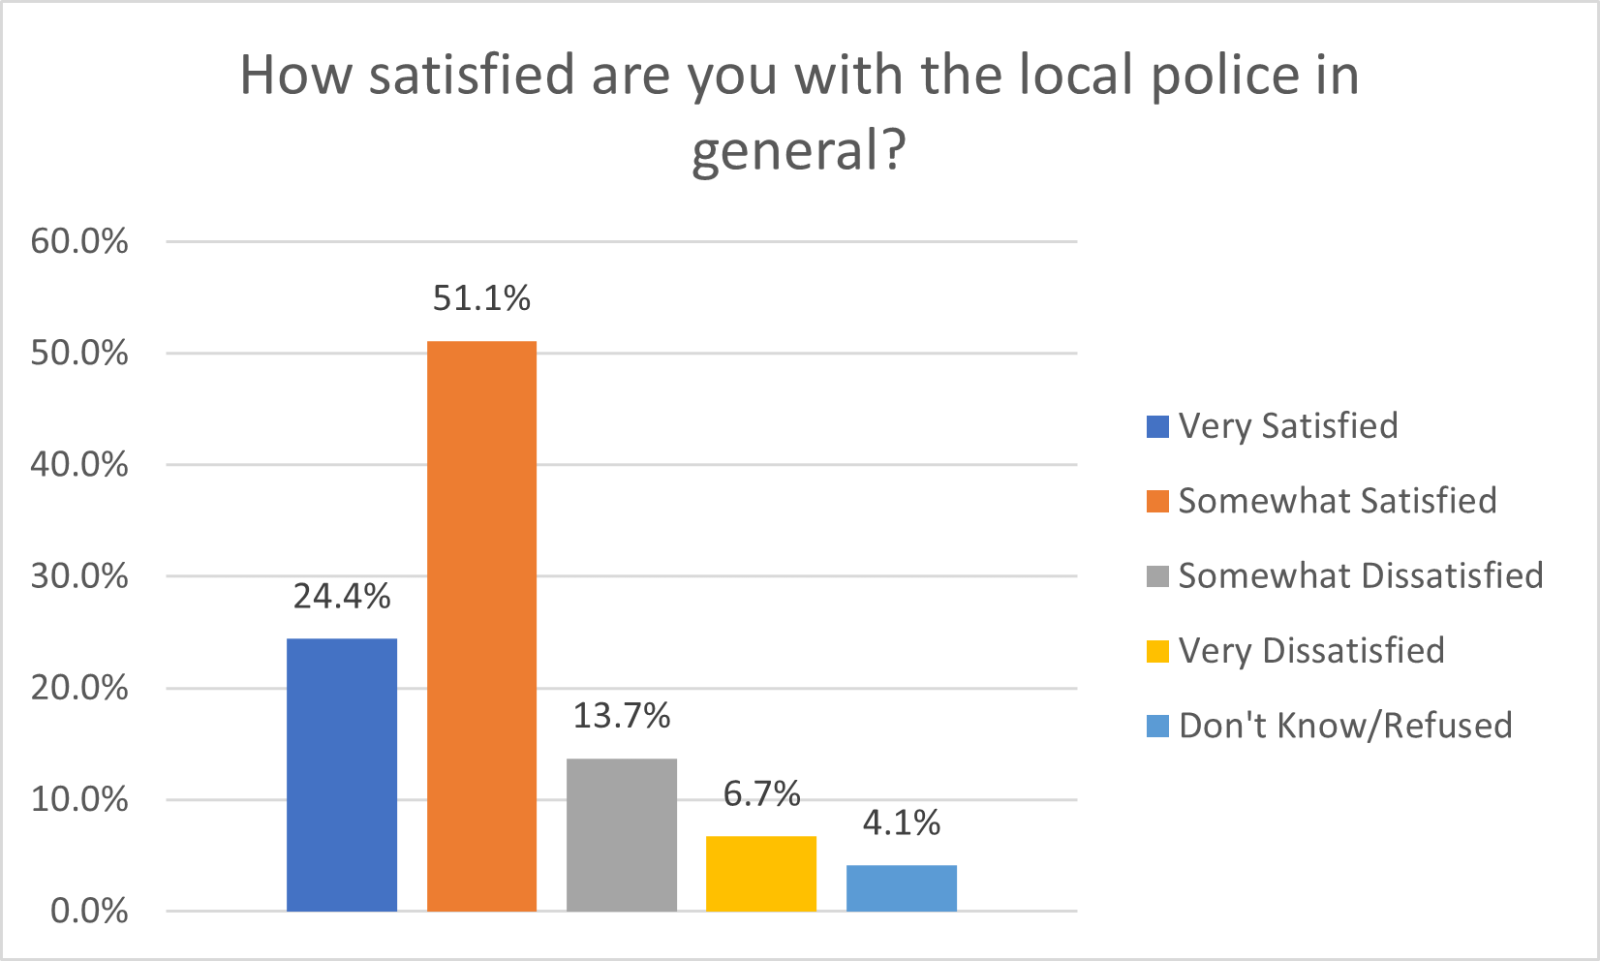
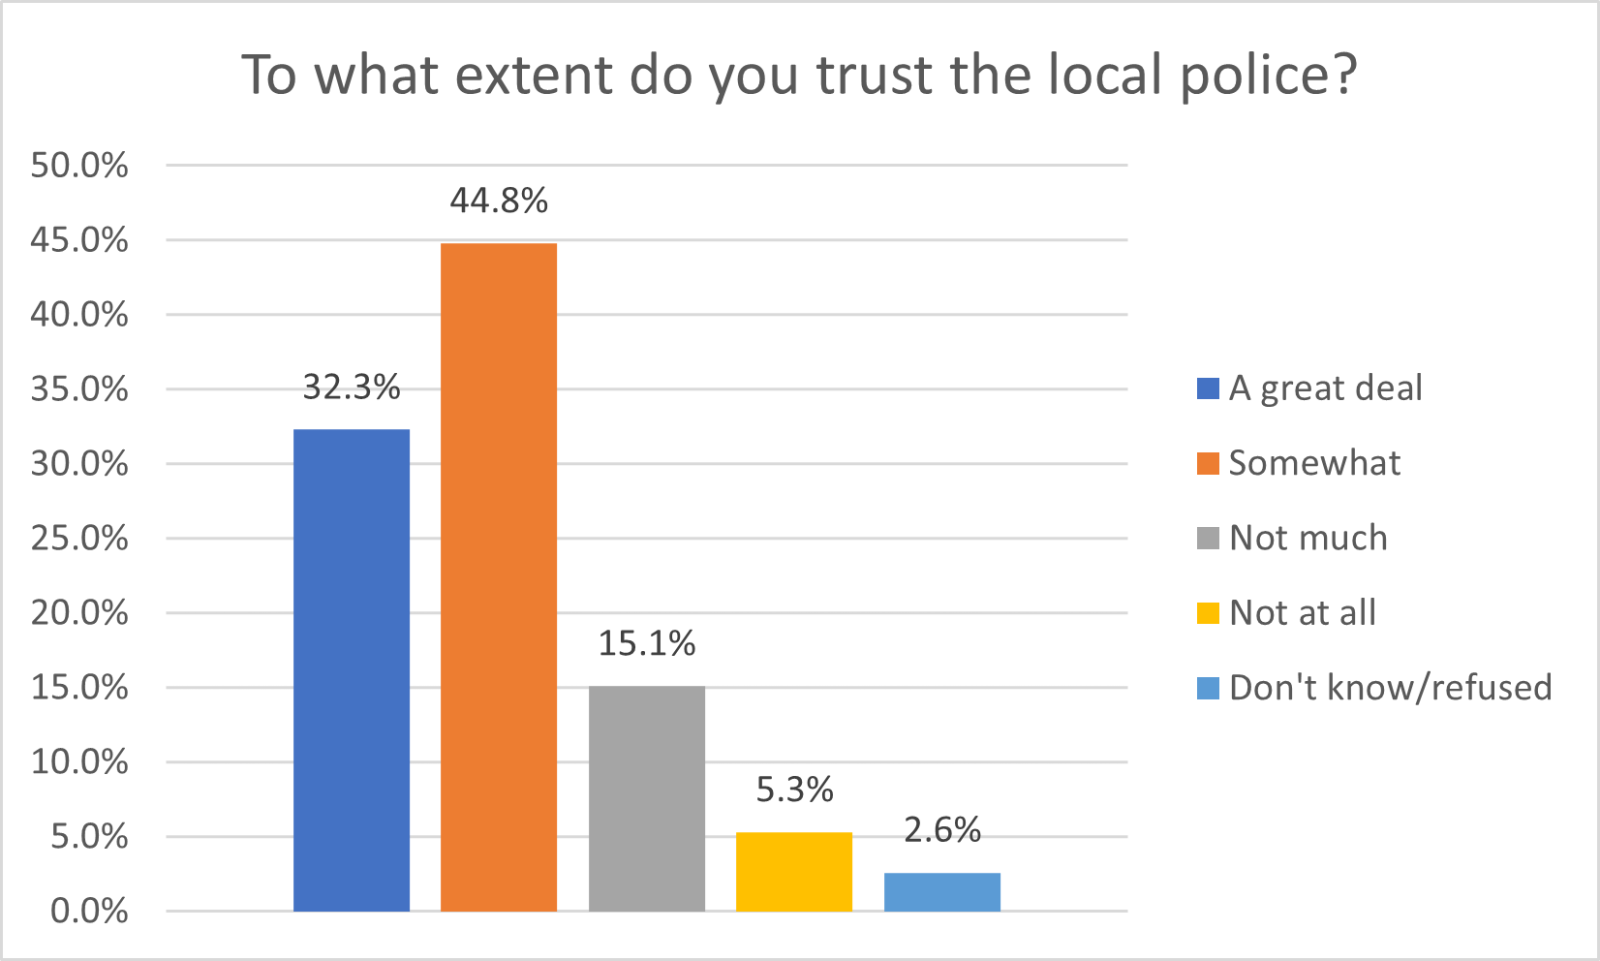
Hampton Roads residents were asked two questions focused on satisfaction with and trust in the police. About three-quarters (75.5%) of respondents indicated that they were either very (24.4%) or somewhat (51.1%) satisfied with the local police. Trust in the police was slightly higher than satisfaction, with 77.1% of respondents trusting the police either a great deal (32.3%) or somewhat (44.8%).
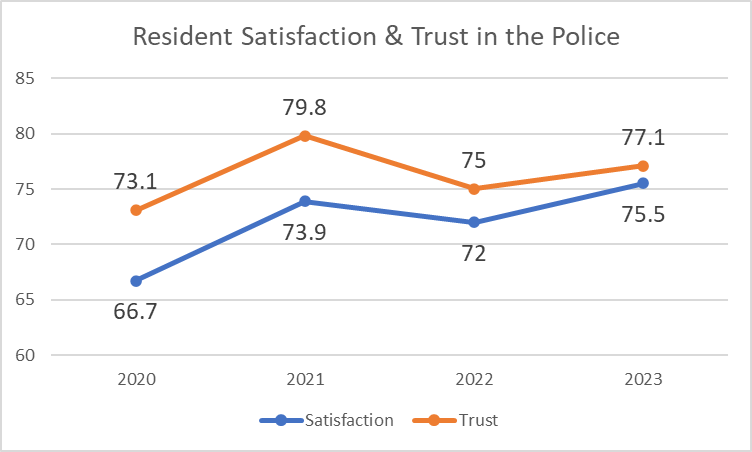
These questions were also asked in the 2020, 2021 and 2022 surveys. Looking over time, there are relatively high levels of both satisfaction and trust with the police, with both measures appreciably higher post-pandemic as opposed to during the pandemic.
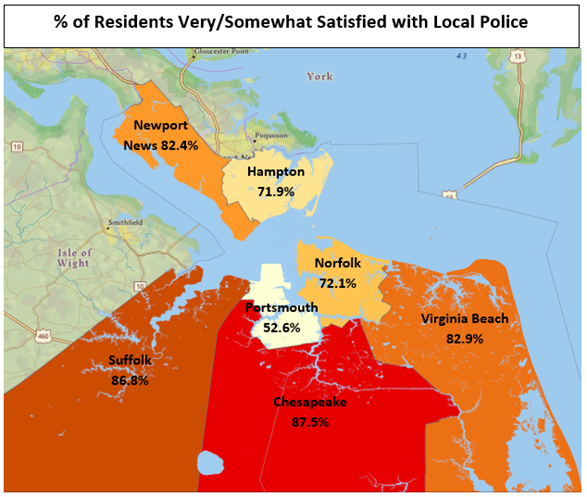
Satisfaction with the police varied significantly by city. More than 80% of respondents in Suffolk (86.8%), Virginia Beach (82.9%), Chesapeake (87.5%) and Newport News (82.4%) reported being very or somewhat satisfied with the police. Less than three-quarters of respondents in Hampton (71.9%), Norfolk (72.1%) reported satisfaction with police, with lowest percentage among residents in Portsmouth (52.6%). Statistically significant and similar inter-city variation was also found for trust in the police.
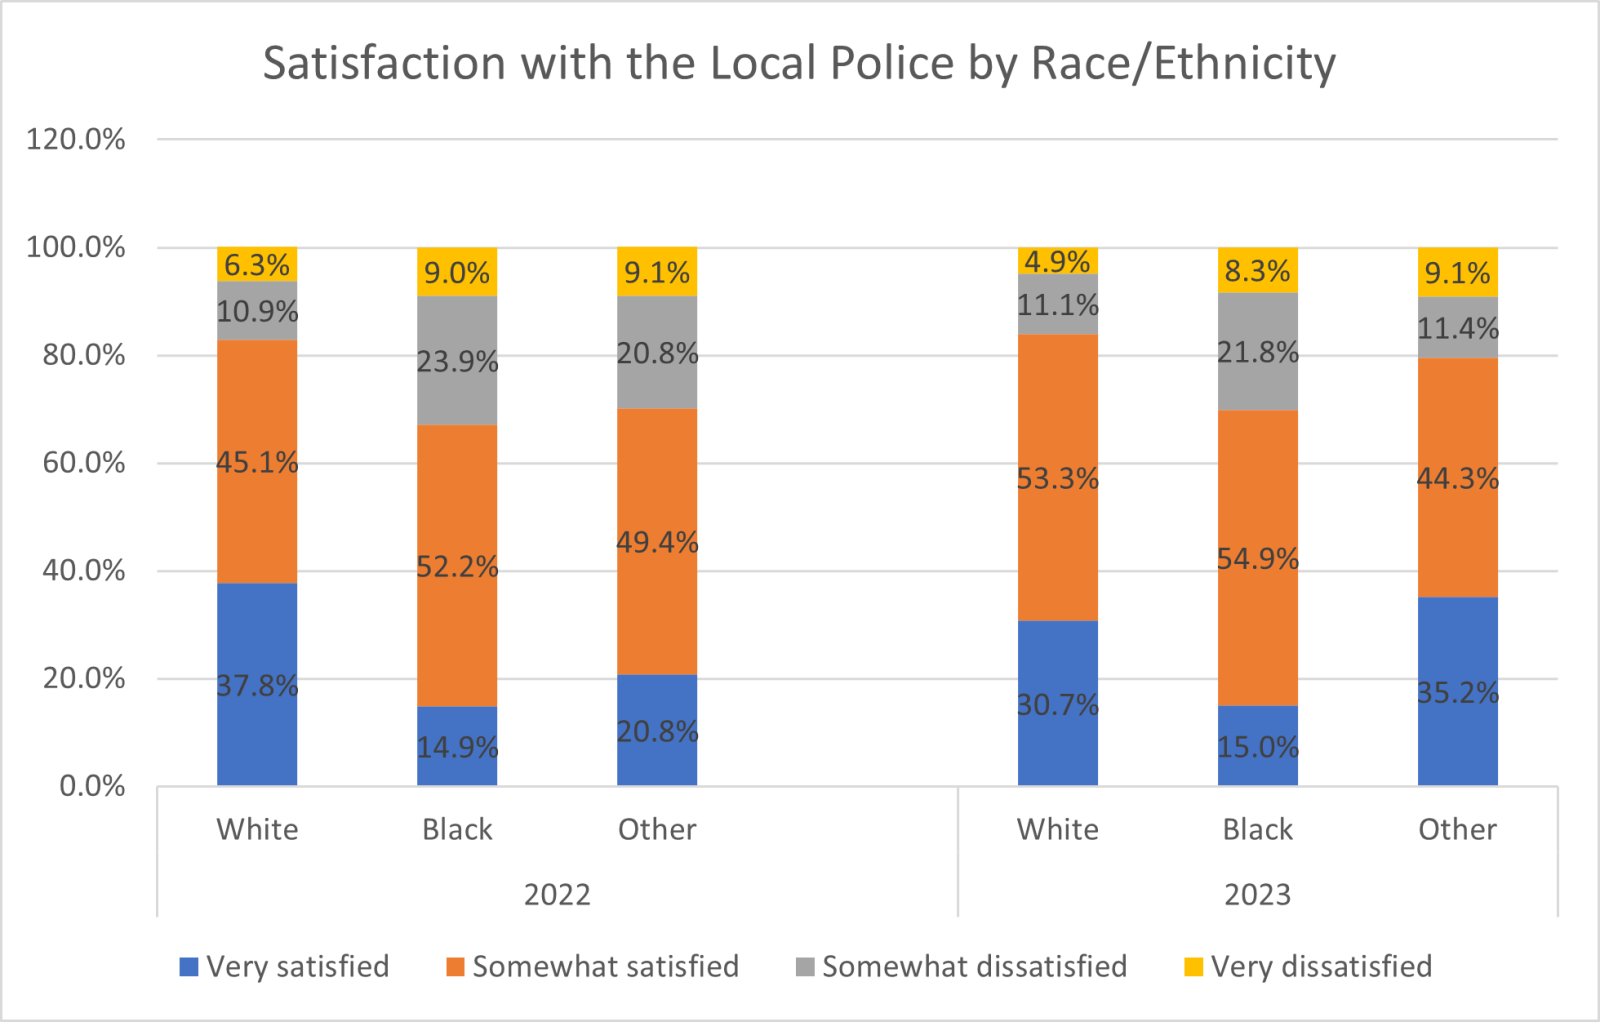
Past findings from the Life in Hampton Roads survey and other research nationwide show that persons of color are less satisfied with and trusting of the police than are whites. The Life in Hampton Roads survey continues to show that persons of color are less satisfied and trusting of the police than are whites. The data from 2022 and 2023 are presented below and show that just over 80% of whites are either somewhat or very satisfied with the police in both years while levels of satisfaction of Black respondents are between 67-70%. In 2022, about 70% of respondents of other racial groups reported being somewhat or very satisfied with the police, reflecting similar levels as Black respondents. In 2023, levels of satisfaction increased to levels comparable to whites at just under 80%.
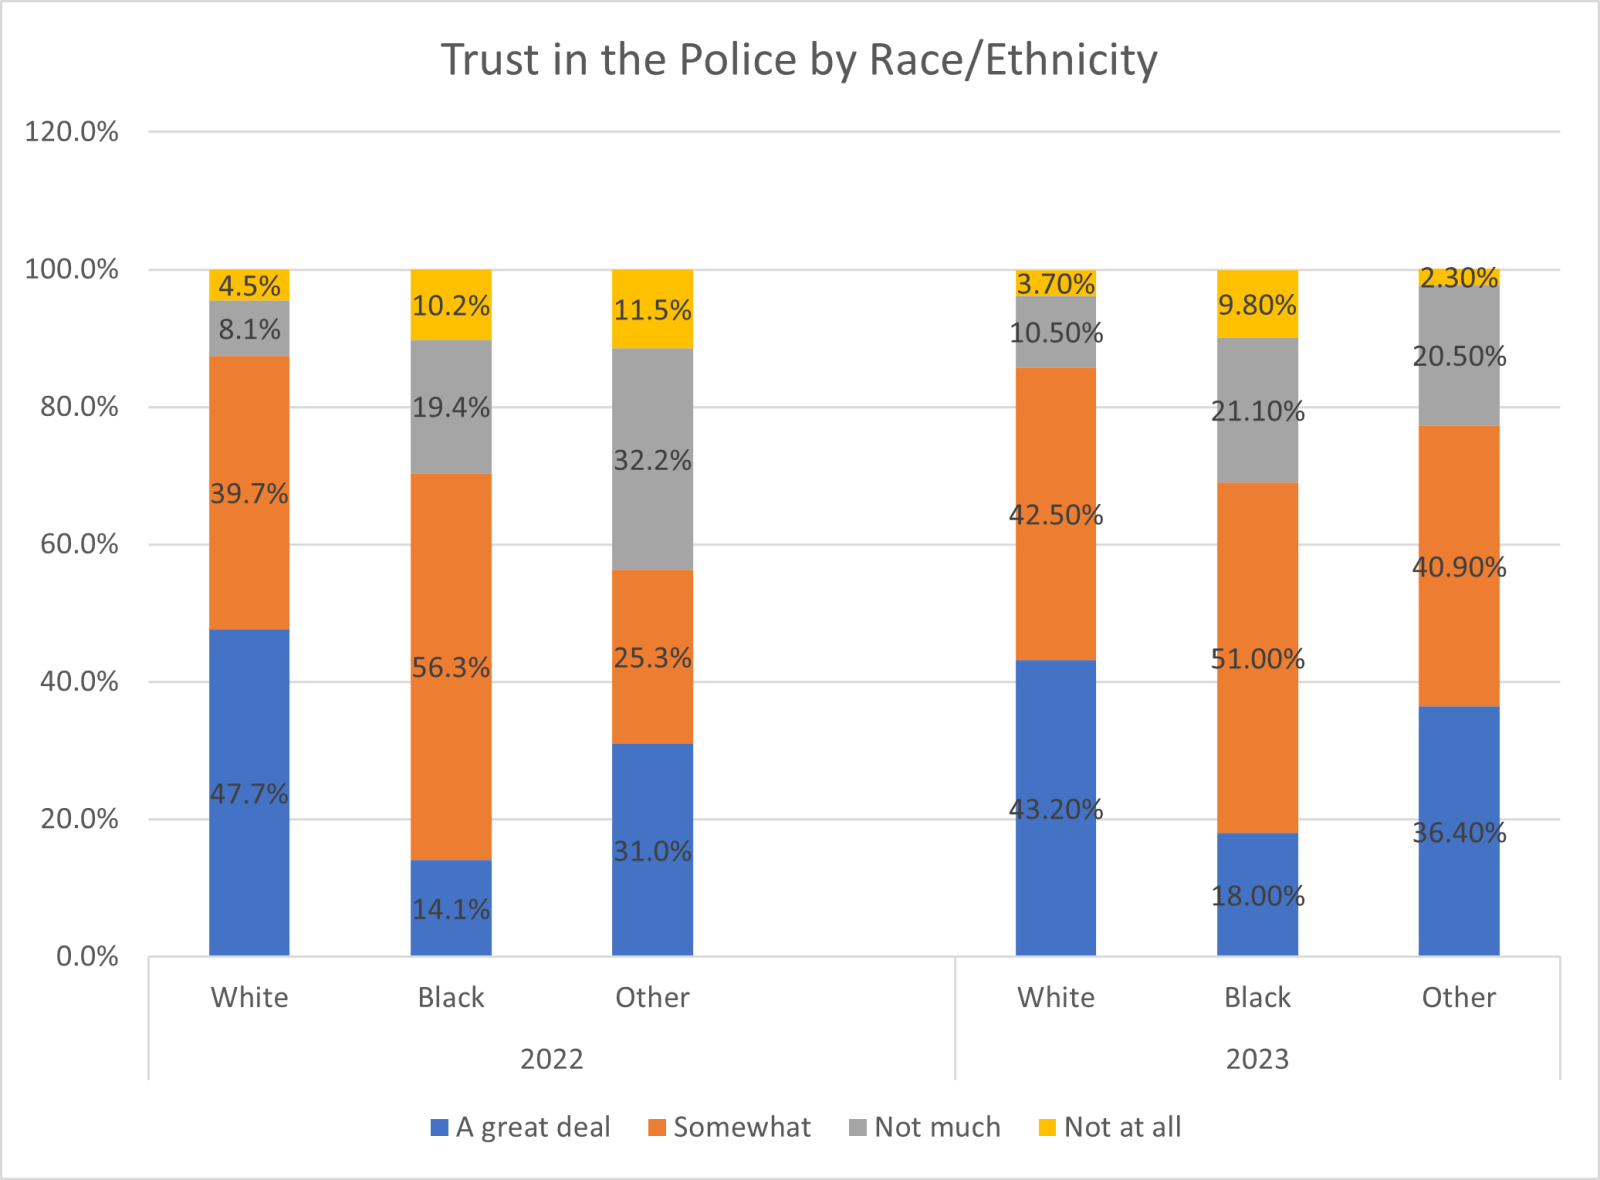
There are also significant differences in trust of the police by race/ethnicity, but the differences are even more striking when focusing on the percentages of residents who report holding a “great deal” of trust in the police. In both years, more than 40% of whites report that they trust the police a great deal, while less than 20% of Blacks report having a great deal of trust (14% and 18% in 2022 and 2023, respectively). In both years, about third of those respondents from other racial groups reported having a great deal of trust in the police (31% and 36%, respectively).
The analyses presented here suggest that there is significant variation across cities and between racial and ethnic groups in attitudes toward the police. Additional analyses show that the differences between cities are mostly explained by the racial composition of those cities. That is, once race/ethnicity is controlled for, the differences between cities are no longer significant.
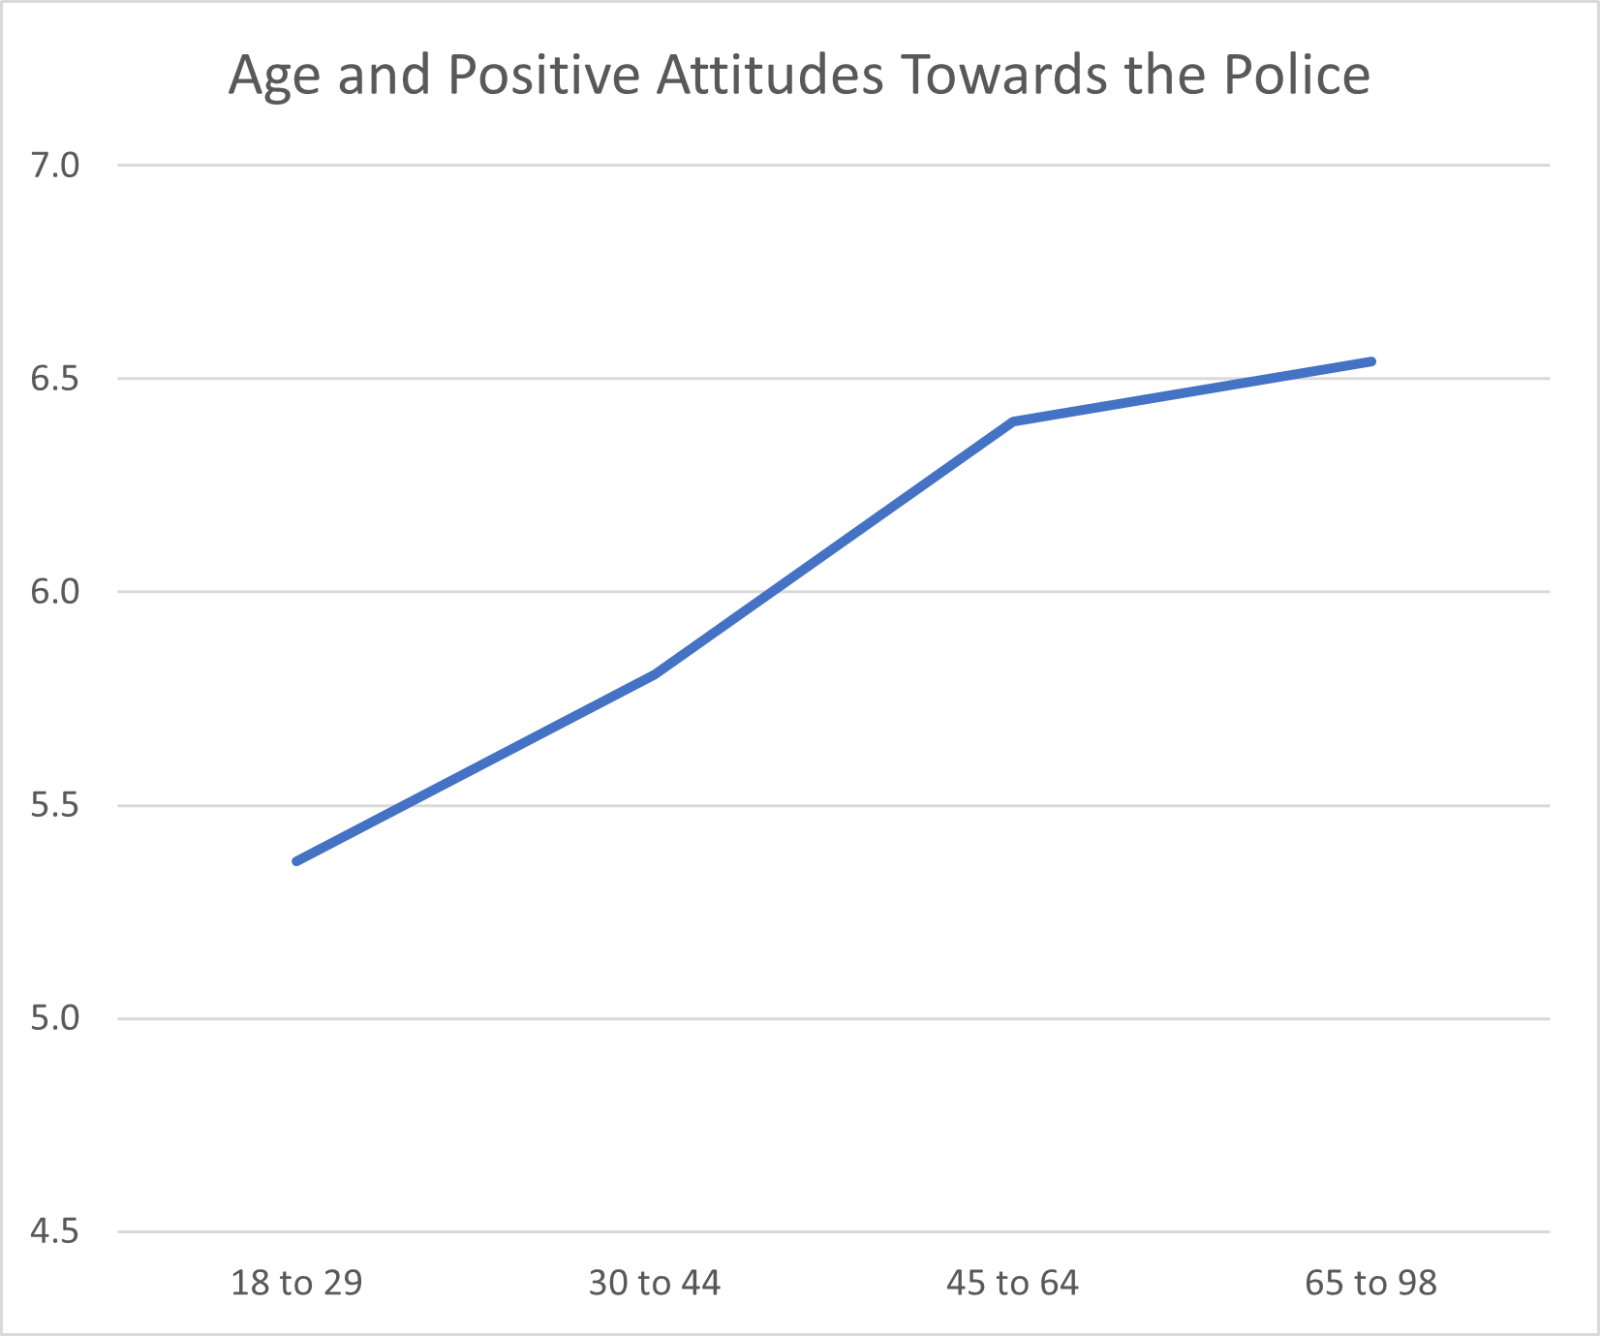
To further explore variation in attitudes toward the police, a composite scale of the two measures was created where higher values indicated more positive attitudes (more trust and satisfaction) toward the police. Several bivariate comparisons provide interesting results. First, although male and female respondents held similar attitudes toward the police, there were fairly striking differences by age of respondents with older respondents holding more positive attitudes than young respondents. That is, as the age of the respondent increased, so too did the positive ratings of the police.
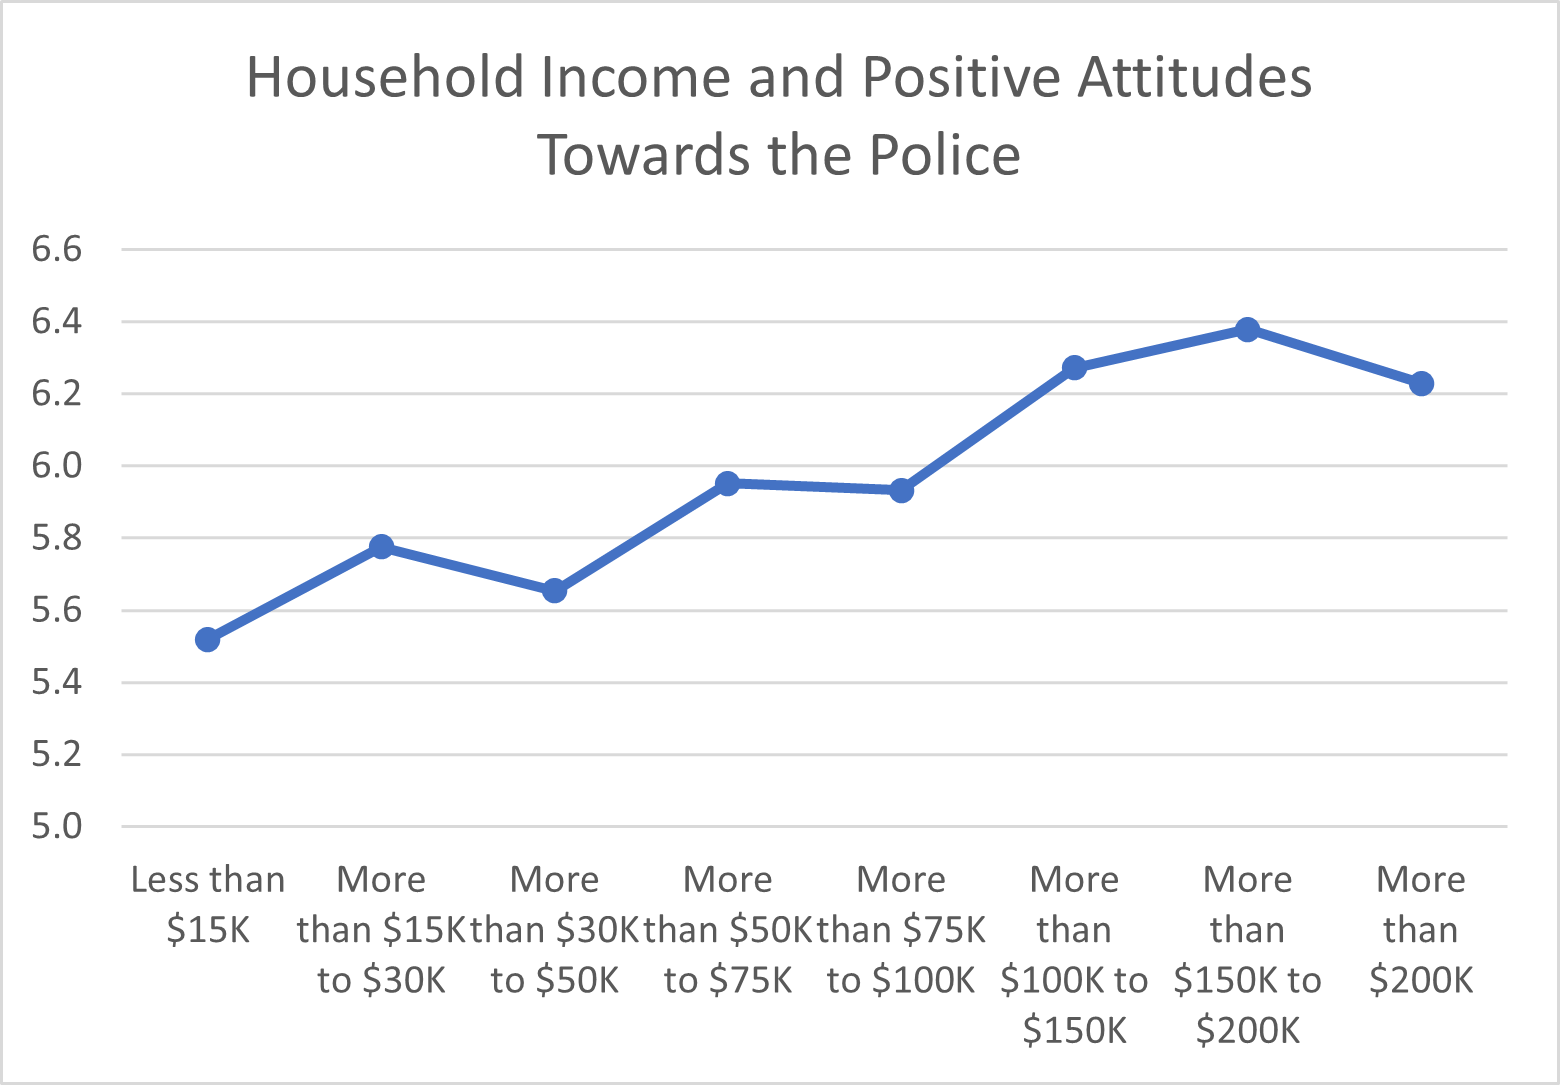
We also found that college-educated respondents held more favorable attitudes toward the police than less-educated respondents and a significant effect of household income with residents in higher-income homes holding more favorable attitudes toward the police.
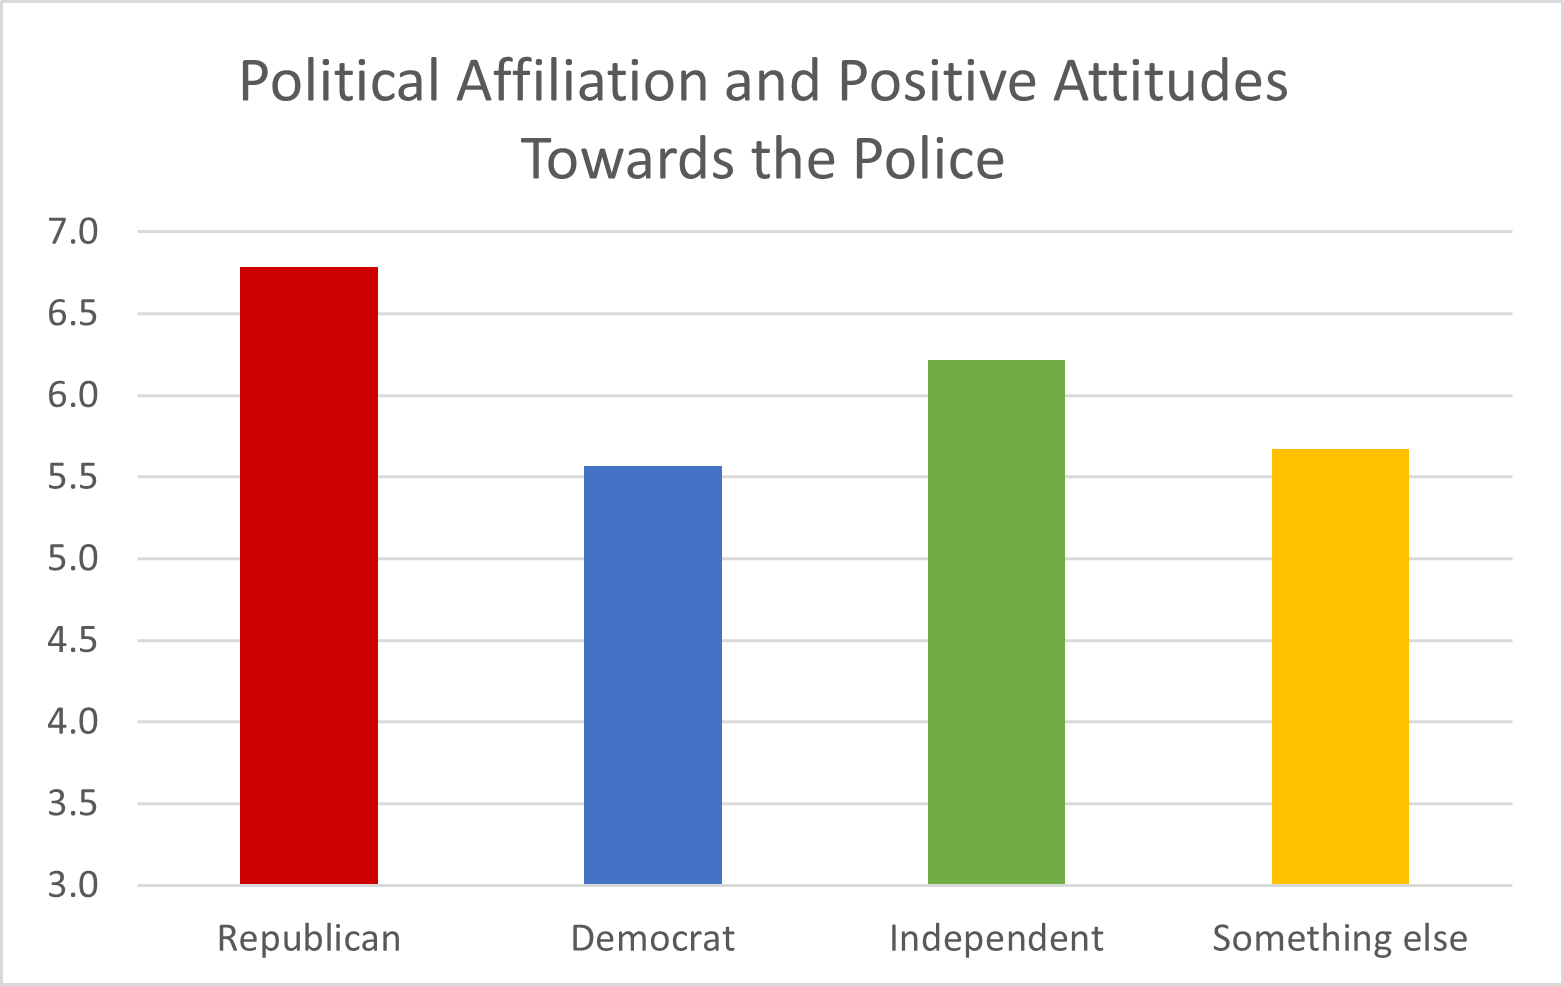
Finally, we find that attitudes toward the police are associated with political affiliation, with Republicans holding more favorable attitudes toward the police than Democrats, independents and those identifying as something else.