The Social Science Research Center (SSRC) at Old Dominion University (ODU) recently completed data collection for the 14th annual Life in Hampton Roads (LIHR) survey. The purpose of this survey is to gain insight into residents’ perceptions of the quality of life in Hampton Roads as well as other topics of local interest such as perceptions of police, politics, the economy, education, and health. A total of 610 telephone surveys were completed between June 6 and Aug. 25, 2023. Surveys this year were completed over the telephone as they were last year and prior to 2020. In 2020, due to COVID-19, surveys were completed via on-line web panels. In 2021, a mixture of online web panels and telephone surveys were utilized. This year, a mixture of listed and random-digit dial (RDD) cell phone and landline telephone numbers were used. From 2012 to 2019, RDD landline and cell phone samples were used. This change limits, to some degree, the ability to compare this year’s results with those from previous years or to confidently generalize the results to the Hampton Roads population as a whole. However, as with previous years, this year’s survey data was weighted to match a city’s population distribution on several variables including race, Hispanic ethnicity, age and gender, along with telephone type (cell only versus landline). Funding for the 2023 survey was provided by the Social Science Research Center. The SSRC would like to thank the College of Arts and Letters and the ODU Office of Research for their continued support of the survey.
Survey Demographics
While most of the data reported here is weighted as described above, demographic data described below is unweighted to provide a description of the demographic coverage achieved by the survey. Of the 610 citizens interviewed, 62% were white, 23% were Black or African American, and 11.9% considered themselves to be another race/ethnicity. This includes 0.3% identifying as American Indian or Alaskan Native, 0.3% Native Hawaiian or Pacific Islander, 1.6% Asian and 6.7% multiracial. In a separate question, 4.6% of respondents indicated that they were of Hispanic/Latino origin.
More than 40% of respondents were male (43.8%) and 54.9% were female and the average age was 52. More than one in three (39.8%) of the respondents received a high school diploma or GED, completed trade or professional school, or attended some college. An additional 44.2% of respondents completed an undergraduate or graduate degree. About half of respondents were married (49.3%) and 19.9% were divorced, separated or widowed. Less than one-quarter of those surveyed were single and not living with a partner (23%) while a small portion of single people reported living with a partner (5.9%).
|
Race |
Percentage |
|
White |
62.0% |
|
Black/African American |
23.0% |
|
American Indian or Alaskan Native |
0.3% |
|
Asian |
1.6% |
|
Native Hawaiian or Pacific Islander |
0.3% |
|
Multiracial |
6.7% |
|
Other |
3.0% |
|
Don’t Know/Refused |
3.2% |
|
Hispanic/Latino Origin? |
Percentage |
|
Yes |
4.6% |
|
No |
93.1% |
|
Don’t know/Refused |
2.3% |
|
Gender |
Percentage |
|
Male |
43.8% |
|
Female |
54.9% |
|
Prefer to self-identify |
0.8% |
|
Refused |
0.5% |
|
Highest level of school completed |
Percentage |
|
Some grade school |
0.2% |
|
Some high school |
2.5% |
|
High school diploma/GED |
12.1% |
|
Completed trade/professional school |
4.6% |
|
Some college |
23.1% |
|
Associate degree |
10.0% |
|
Bachelor’s degree |
23.4% |
|
Graduate degree |
20.8% |
|
Other |
2.6% |
|
Don’t Know/Refused |
0.7% |
|
Age |
Age in years |
|---|---|
|
Average age (years) |
52 |
|
Marital Status |
Percentage |
|
Single, not living with partner |
23.0% |
|
Single, living with partner |
5.9% |
|
Married |
49.3% |
|
Divorced/separated |
10.7% |
|
Widowed |
9.2% |
|
Refused |
2.0% |
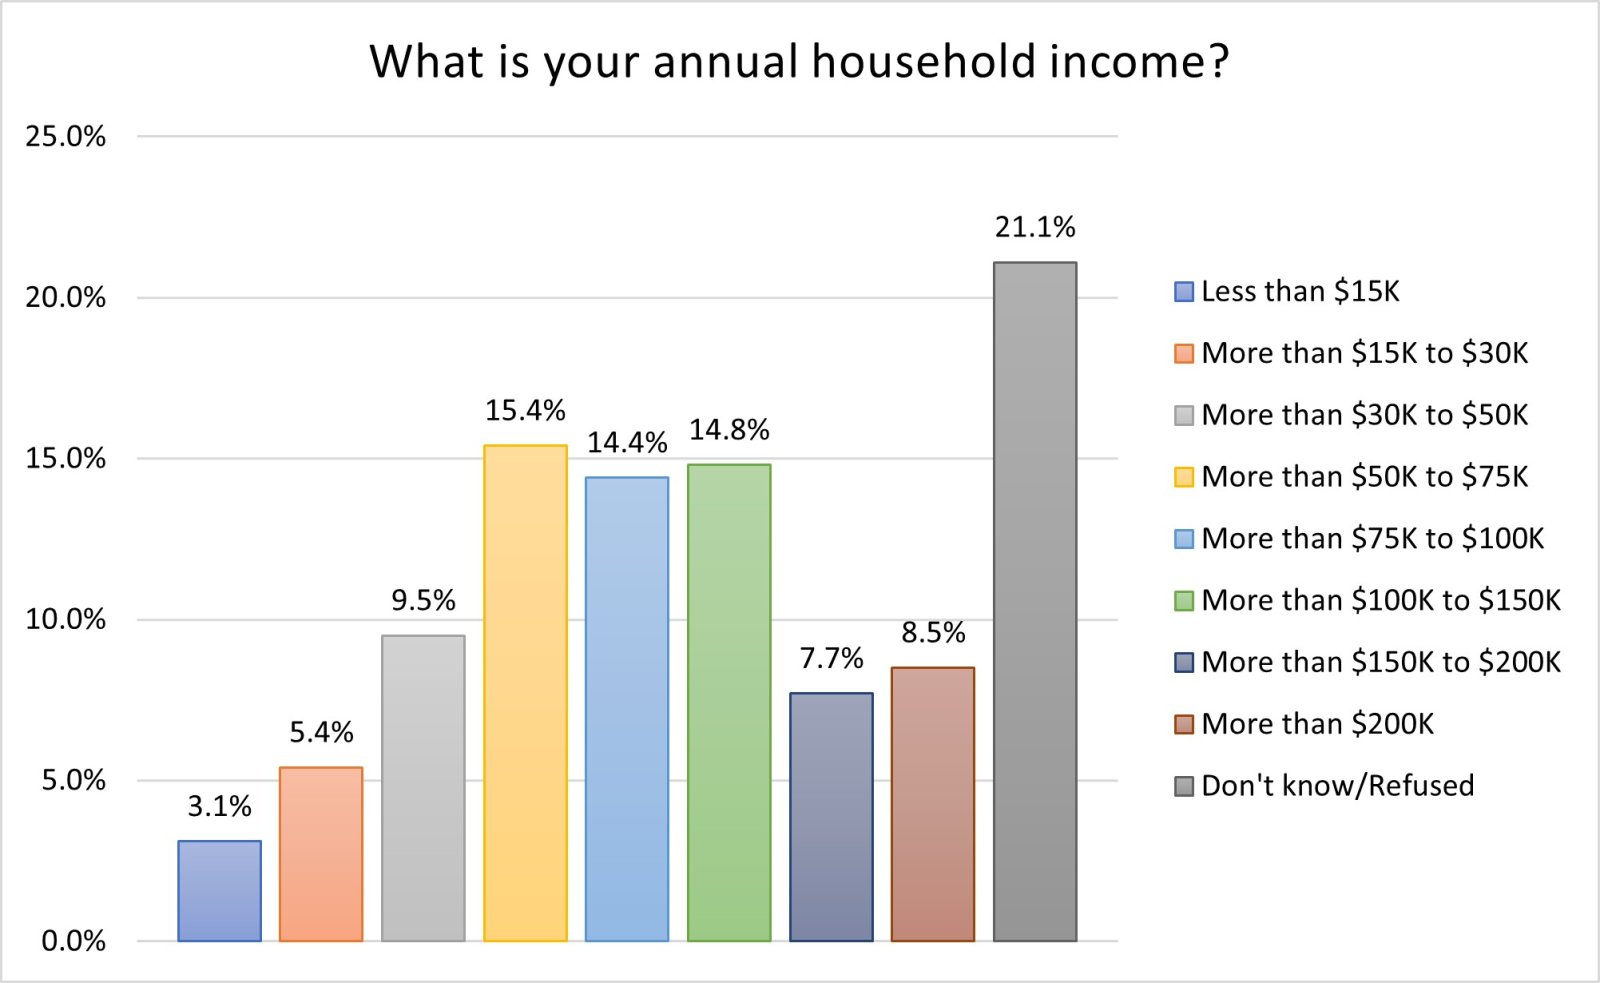
Only 8.5% of participants reported their annual household income as $30,000 or less, a quarter of respondents (24.9%) reported earning more than $30,000 to $75,000, while 45.4% earned more than $75,000. This is the most commonly refused demographic question in the survey, with 16.7% declining to answer and another 4.4% responding with “don’t know.”