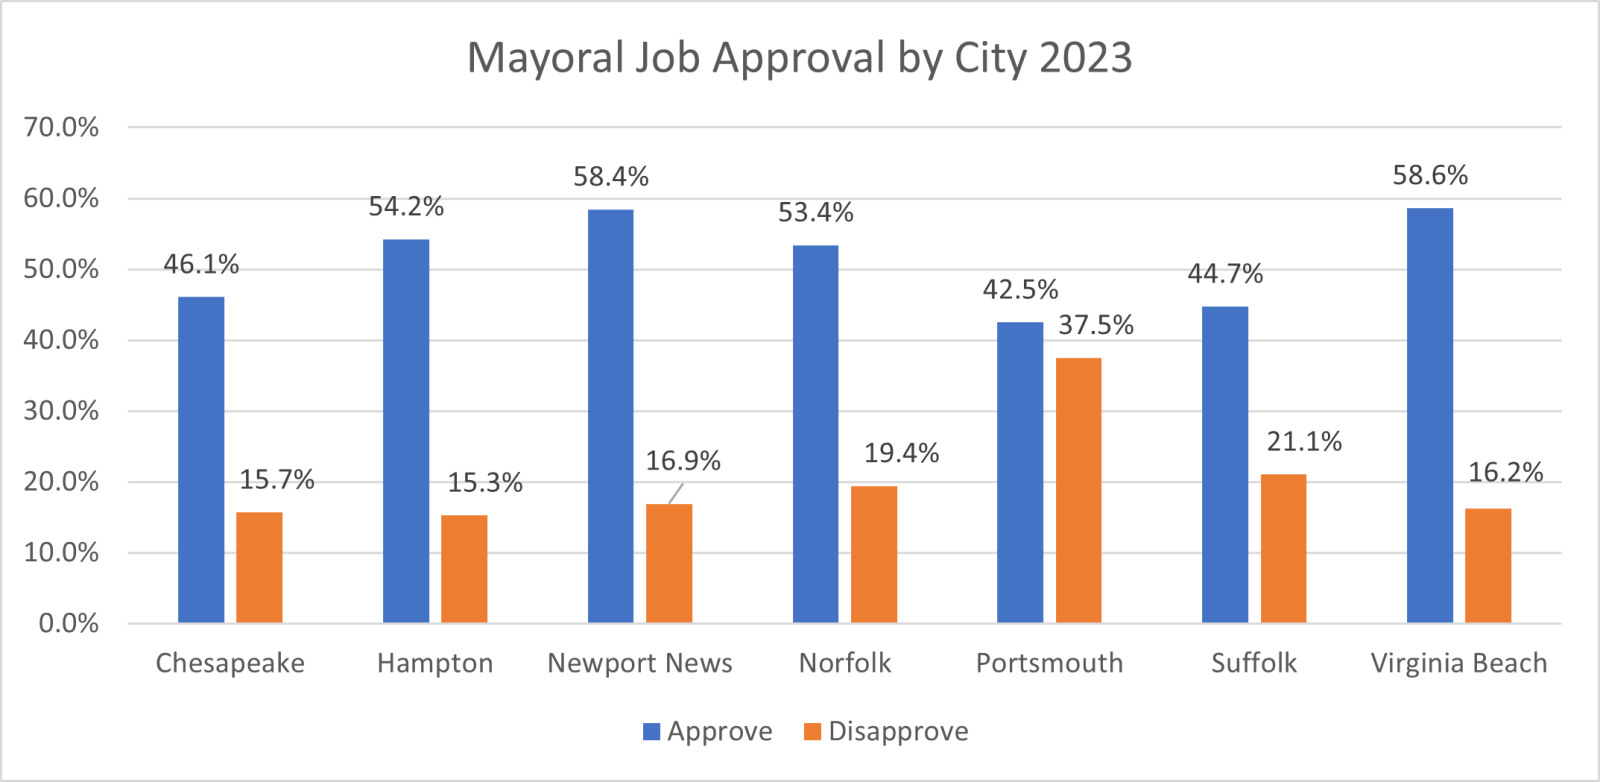
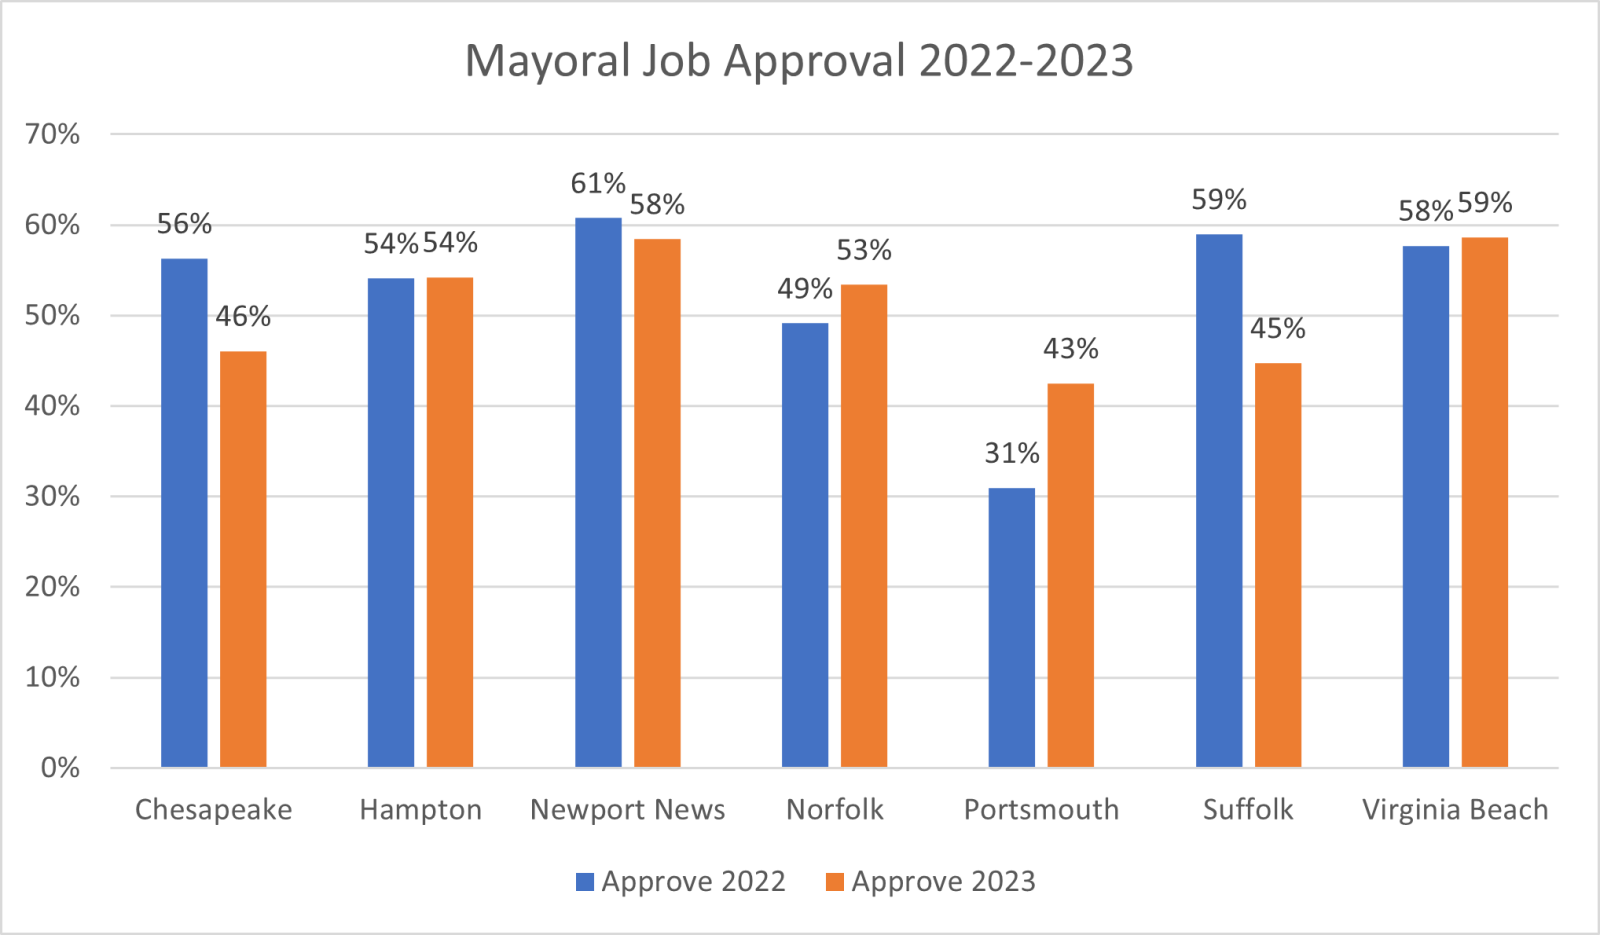
As in previous years, the survey asked about mayoral job approval. Responses to this question were relatively strong for most mayors in 2023. Approximately 53% indicated that they approved or strongly approved (53.4%) while 18.5% voiced disapproval. Whereas in previous years Portsmouth has often been far below other cities in terms of approval of the mayor, Portsmouth’s mayoral approval climbed from 31% to 43% and was joined by two other cities where approval of the mayor was in the 40-50% range – Suffolk (44.7%) and Chesapeake (46.1%). Approval for the Norfolk mayor also improved from 49% to 53%. Portsmouth does remain unique as the only city where more than 30% (37.5%) of respondents disapprove of their city’s leadership, although this is a vast improvement for the city since disapproval stood at 57% in the 2022 survey. It is important to remember that the overall sample sizes here are quite small at the city level. Nonetheless, the data seems to suggest that the city leadership in some of the cities surveyed has more work to do to win public trust than does the leadership in other cities. Norfolk and Portsmouth seem to have made progress, but other cities (especially Suffolk and Chesapeake) have lost ground.
How well-represented are you? Do you pay attention to your local government? These questions were included on the 2023 survey and the results show that those who paid attention to decisions made by their local government thought they were better represented than those who did not pay attention. Perceptions of representation did not differ significantly by race.
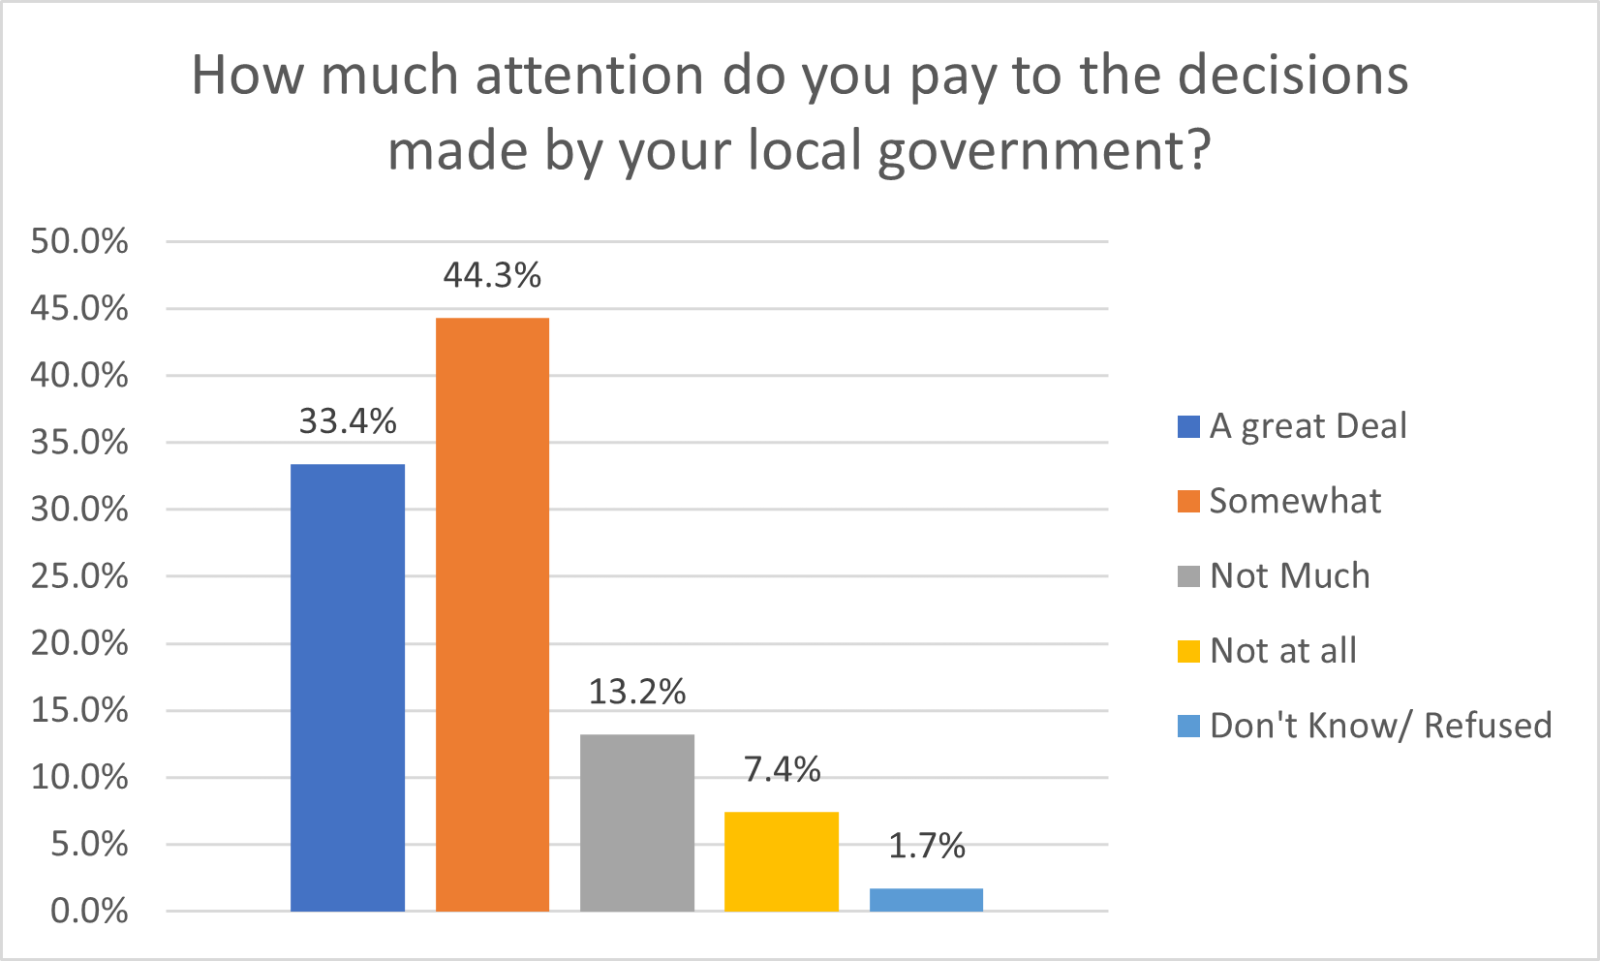
Overall, more than three-quarters of respondents indicated that they pay at least some attention to decisions made by their local governments. One-third of respondents (33.4%) indicated that they pay “a great deal” of attention, and another 44.3% indicated that they pay attention “somewhat.”
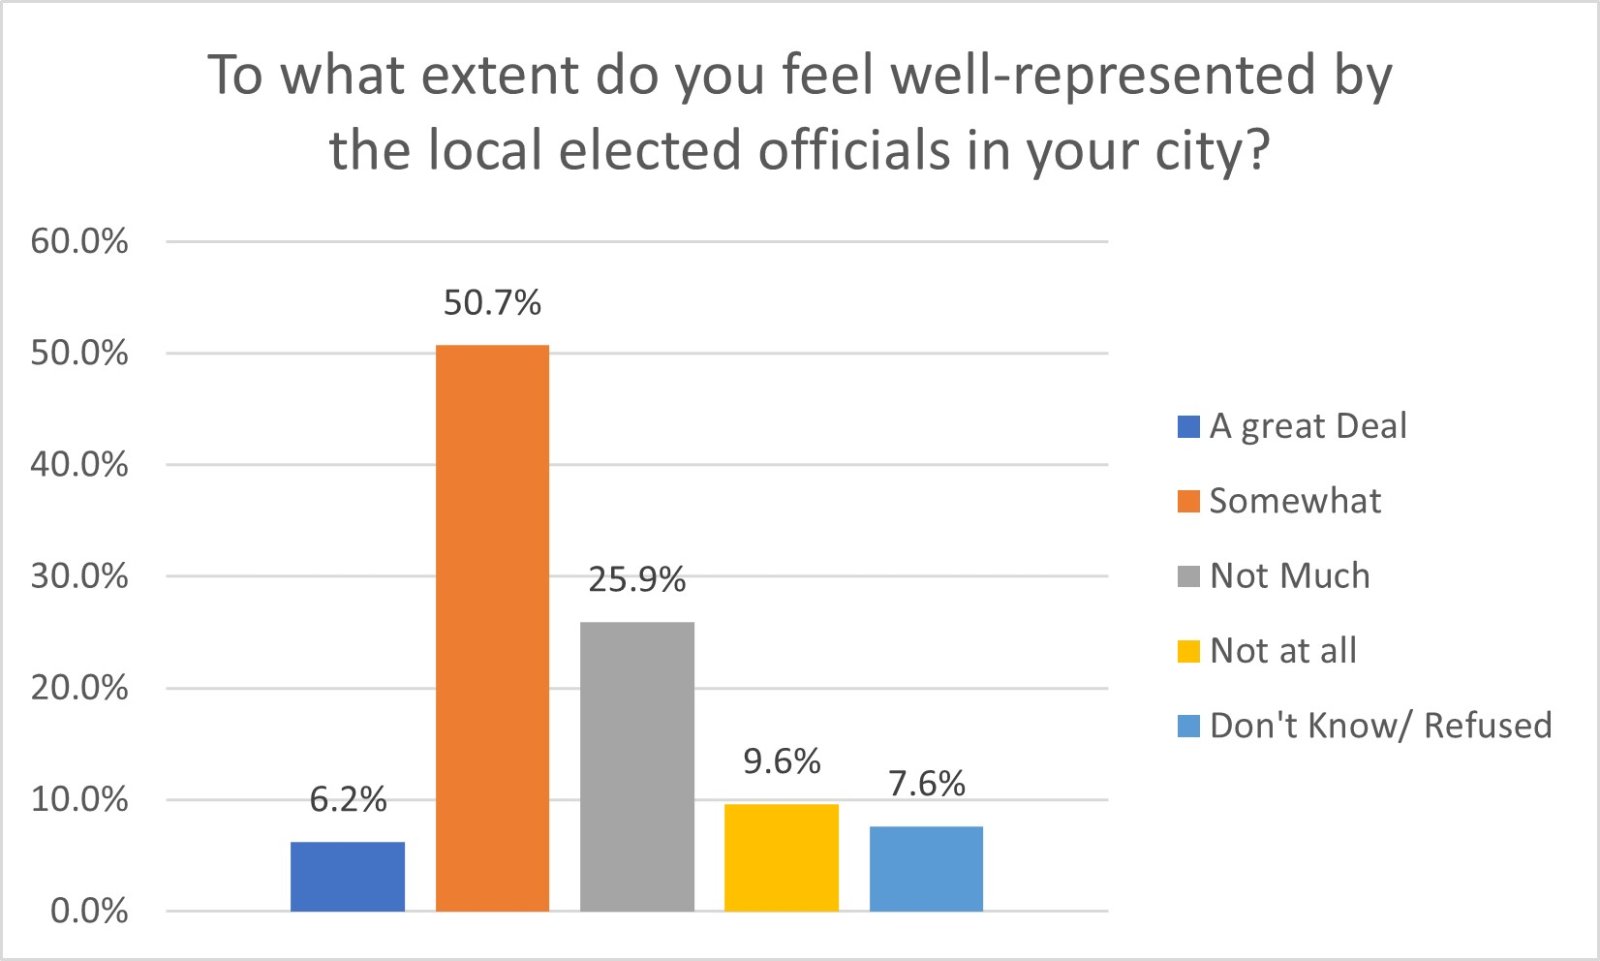
This year’s survey included a new question concerning the quality of representation. Respondents were asked: “To what extent do you feel well-represented by the local elected officials in your city?” Overall, the response was a collective shrug. Only 6.2% of respondents indicated that they thought they were well-represented “a great deal” but half (50.7%) indicated that they were “somewhat” well-represented. Another quarter of respondents (25.9%) indicated that they thought they were “not much” represented.
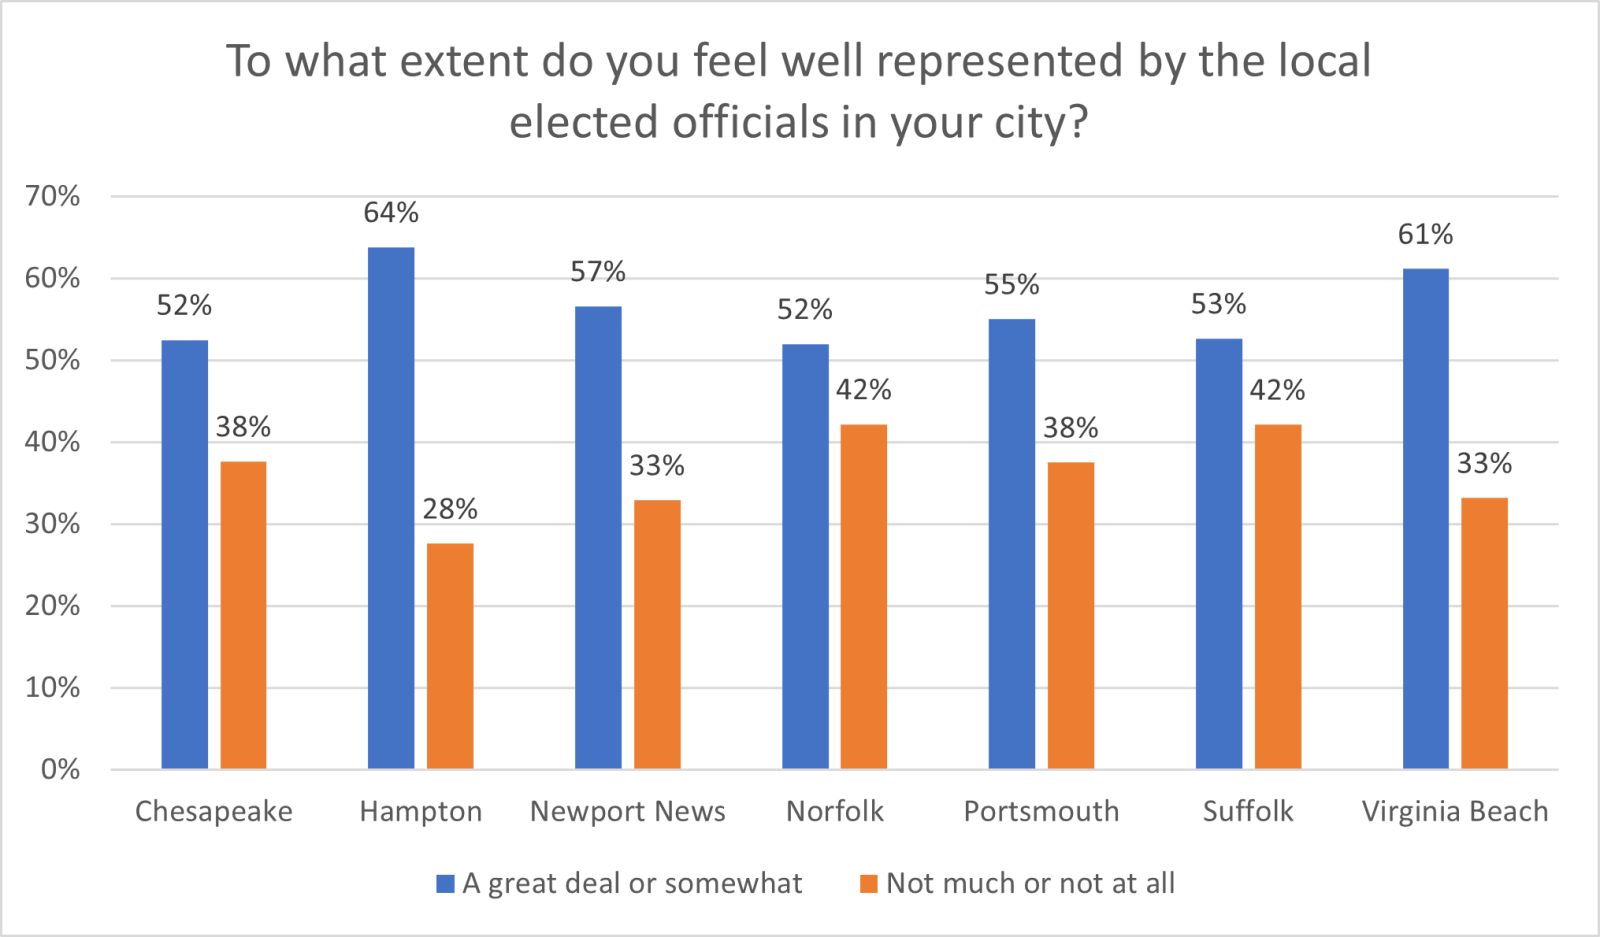
There was limited yet statistically significant variation across cities in terms of feeling represented, and Norfolk was perhaps notable for having the largest percentage responding “a great deal” (11.8%) and simultaneously the largest percentage responding “not at all” (16.7%), and the smallest differential between those who thought they were relatively well represented (52%) and those who did not (42%). Overall, respondents in Hampton were the most likely to indicate that they felt well represented “a great deal” or “somewhat” (64%), and the least likely to respond that they felt represented “not much” or “not at all” (28%).
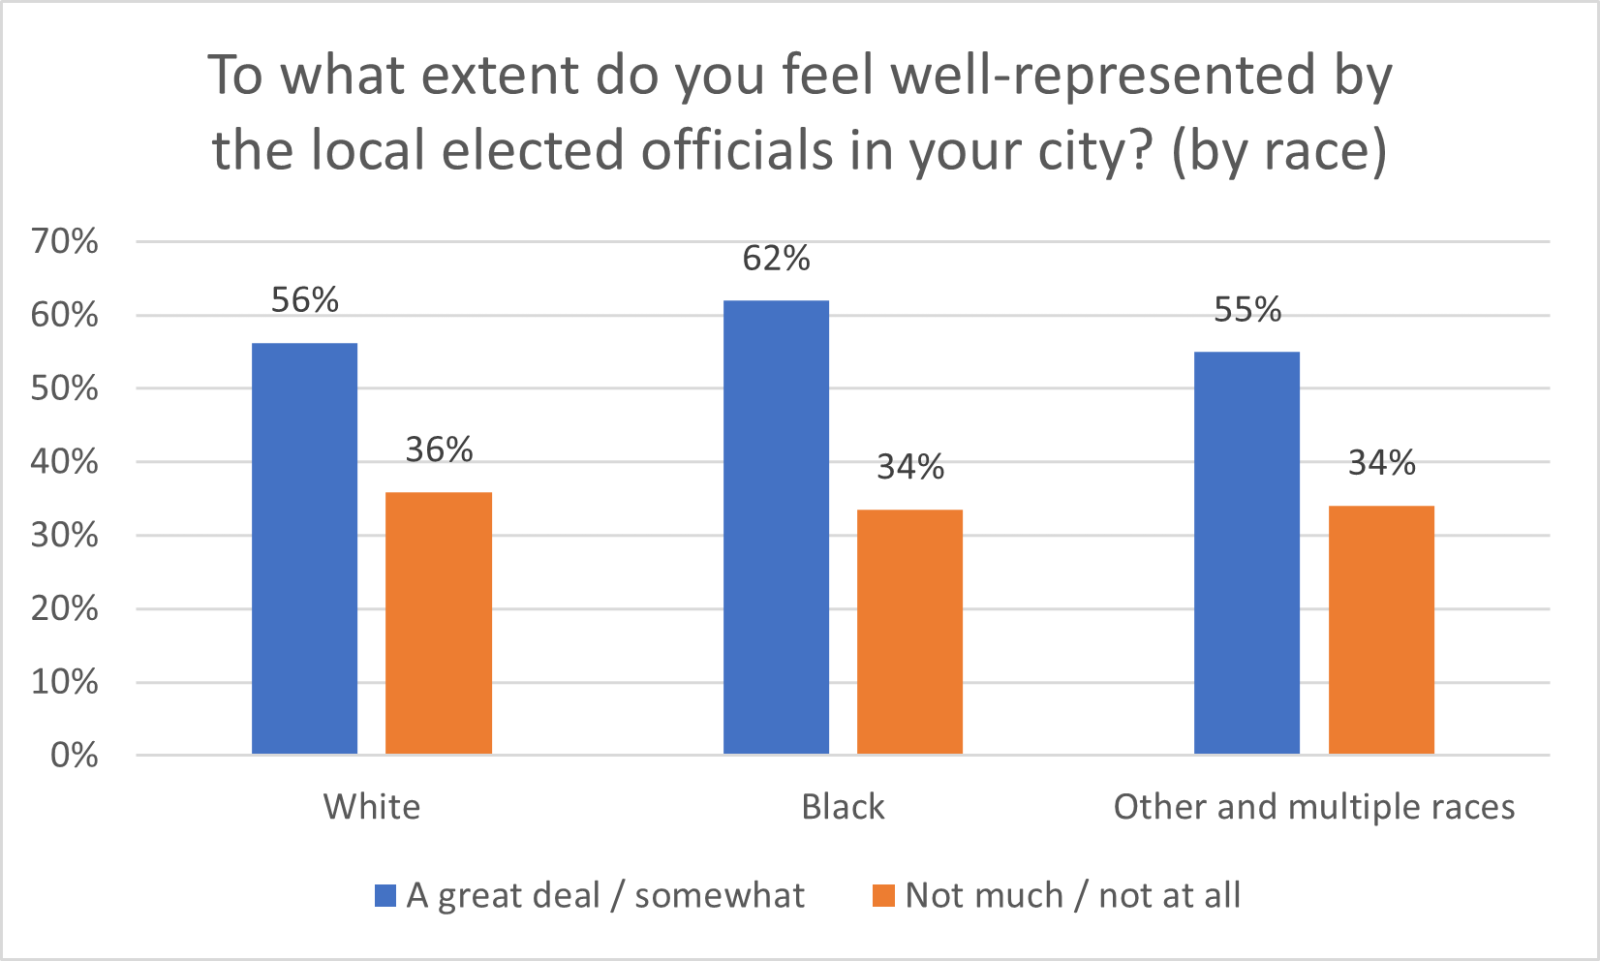
There was relatively little difference in responses to the representation question across racial categories. Overall, Black respondents were slightly more likely to report that they felt well-represented, but the differences between racial groups were not statistically significant. The relatively similar responses to this question across racial groups are modestly encouraging: if there were significant differences among racial groups in terms of feeling that they were not well-represented, that would be cause for concern.
Age was associated to some degree with perceptions of the quality of representation. Respondents who were 65 or older were the most likely to feel that they were represented “a great deal” (11.5%) or “somewhat” (58.7%).
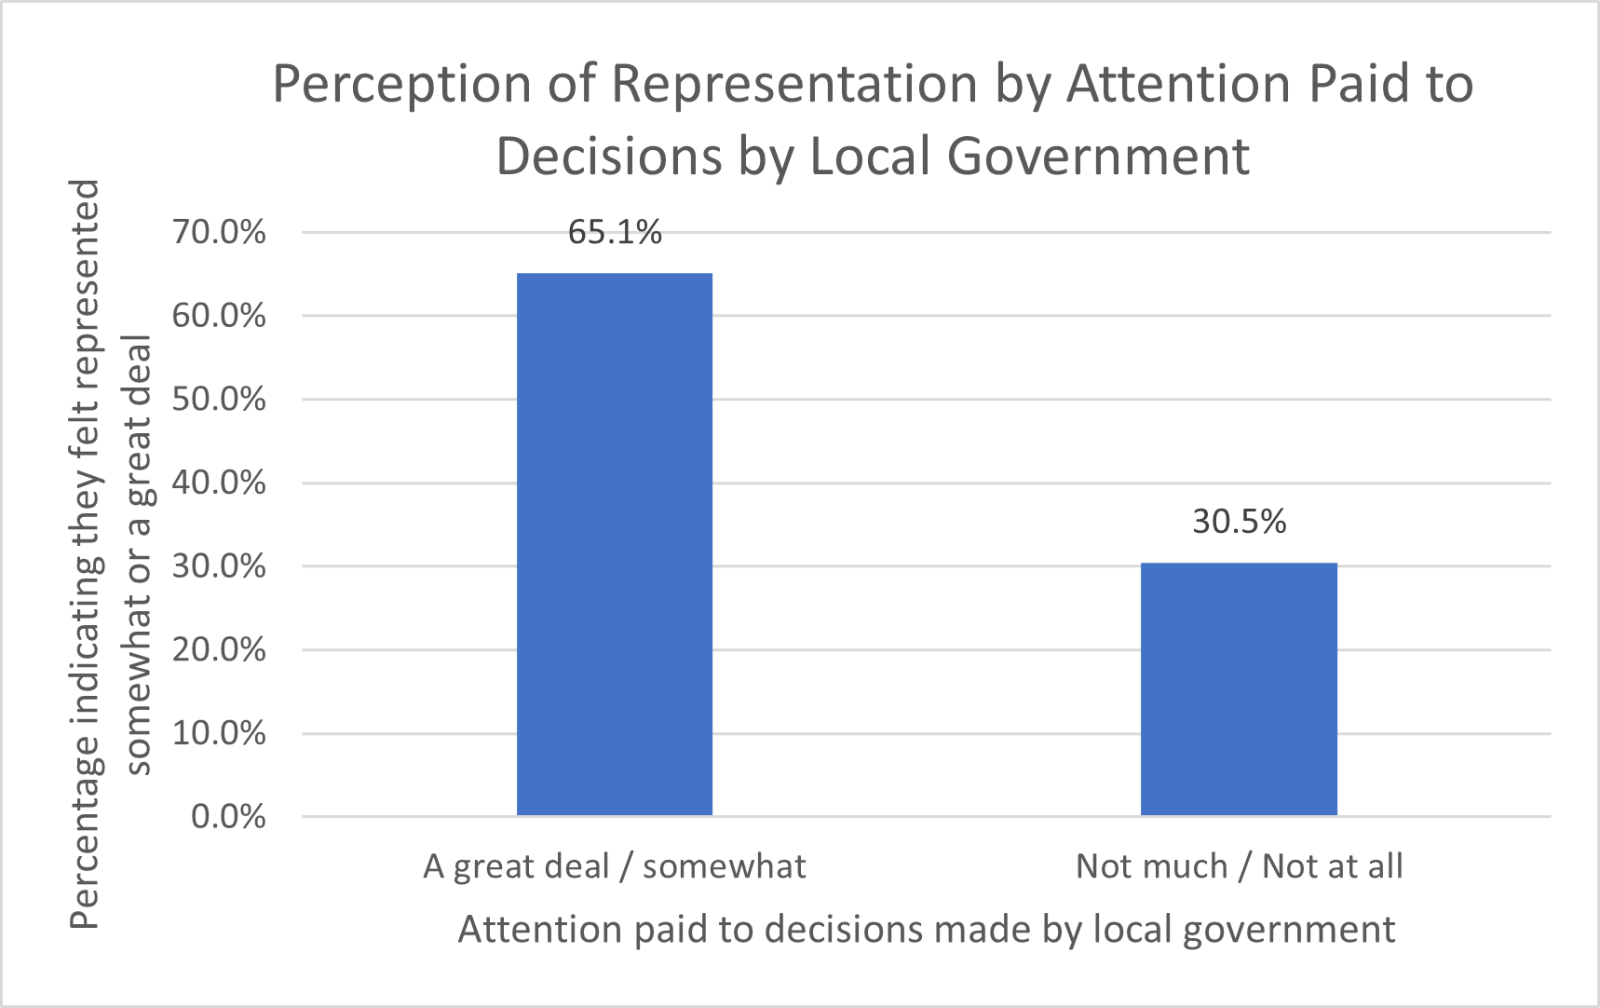
Responses to the local politics attention and representation questions were strongly associated with each other: respondents who indicated that they paid more attention were more likely to indicate that they thought they were well represented. This is encouraging in some respects – those who pay attention feel better represented, so perhaps if others paid attention they would also feel more adequately represented. But an alternative interpretation is that those who feel poorly represented may be tuning out and failing to pay the attention that would be needed for them to pressure local governments to represent them better.
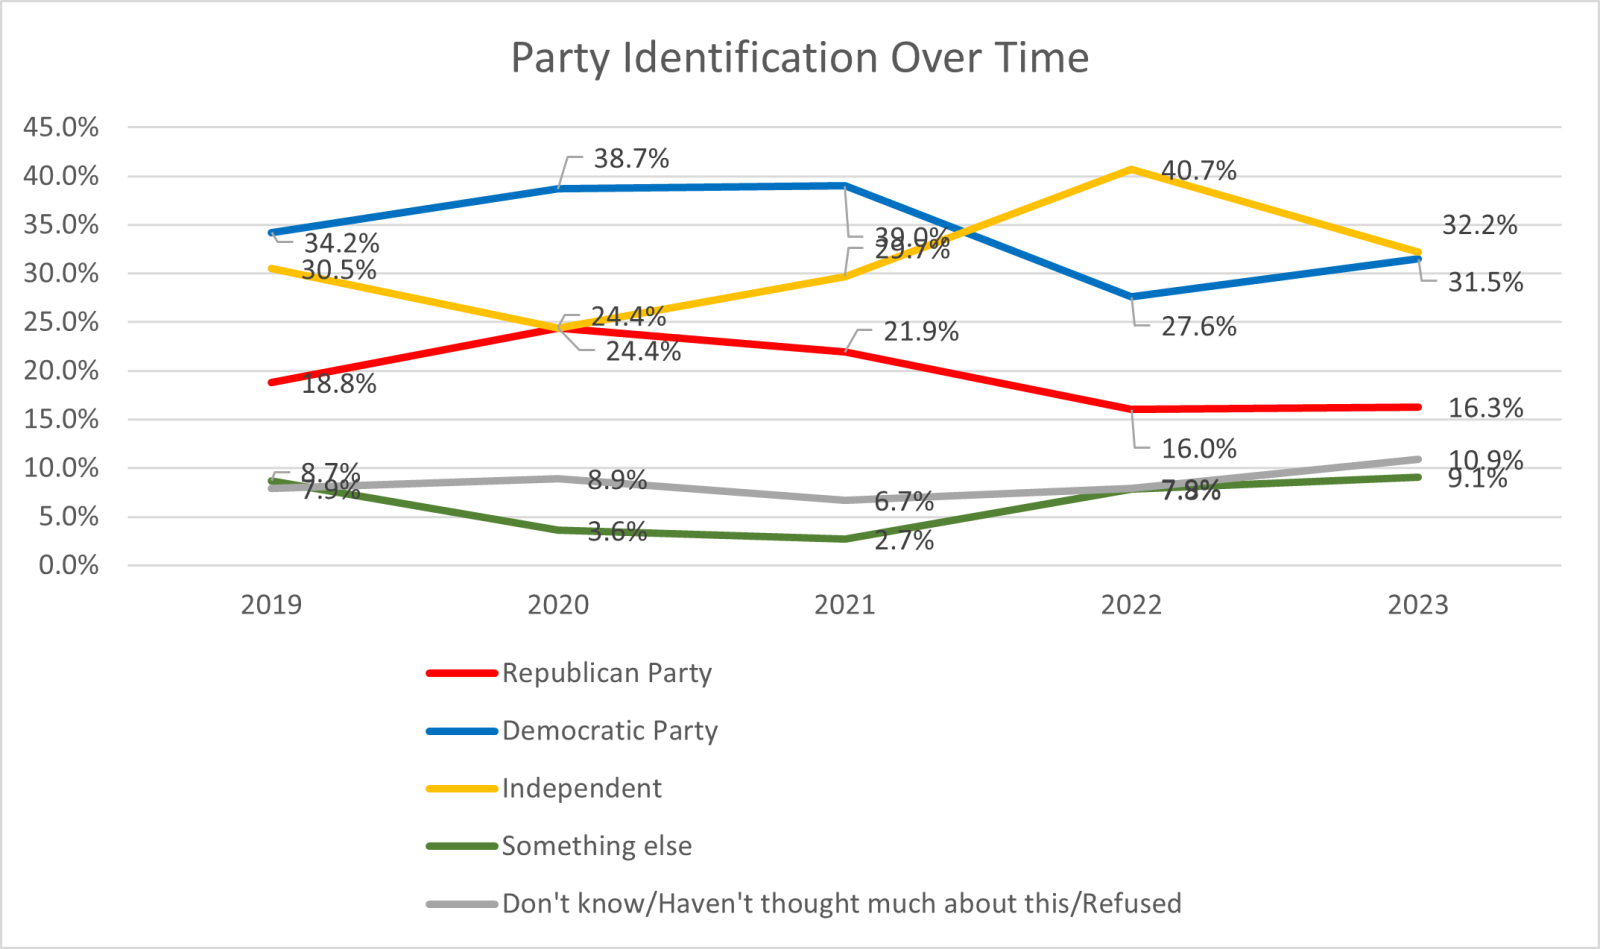
Political party affiliation among respondents to the survey continued to lean substantially toward the Democratic Party, in line with past Life in Hampton Roads’ surveys. More than 31% of respondents said they felt closest to the Democratic party when asked the question: “Do you generally feel closer to the Democratic Party, the Republican Party, or do you consider yourself to be an independent or something else?” Approximately 16% responded Republican Party. Affiliation with both parties remains lower than in several recent years, although Democratic affiliation has increased modestly from last year (27.6%). As in 2022, more respondents identified as independents than with either party alone with less than half of respondents affiliated with the major parties. Weakening party affiliations potentially open the door for more individuals to support third-party candidates in the 2024 elections.
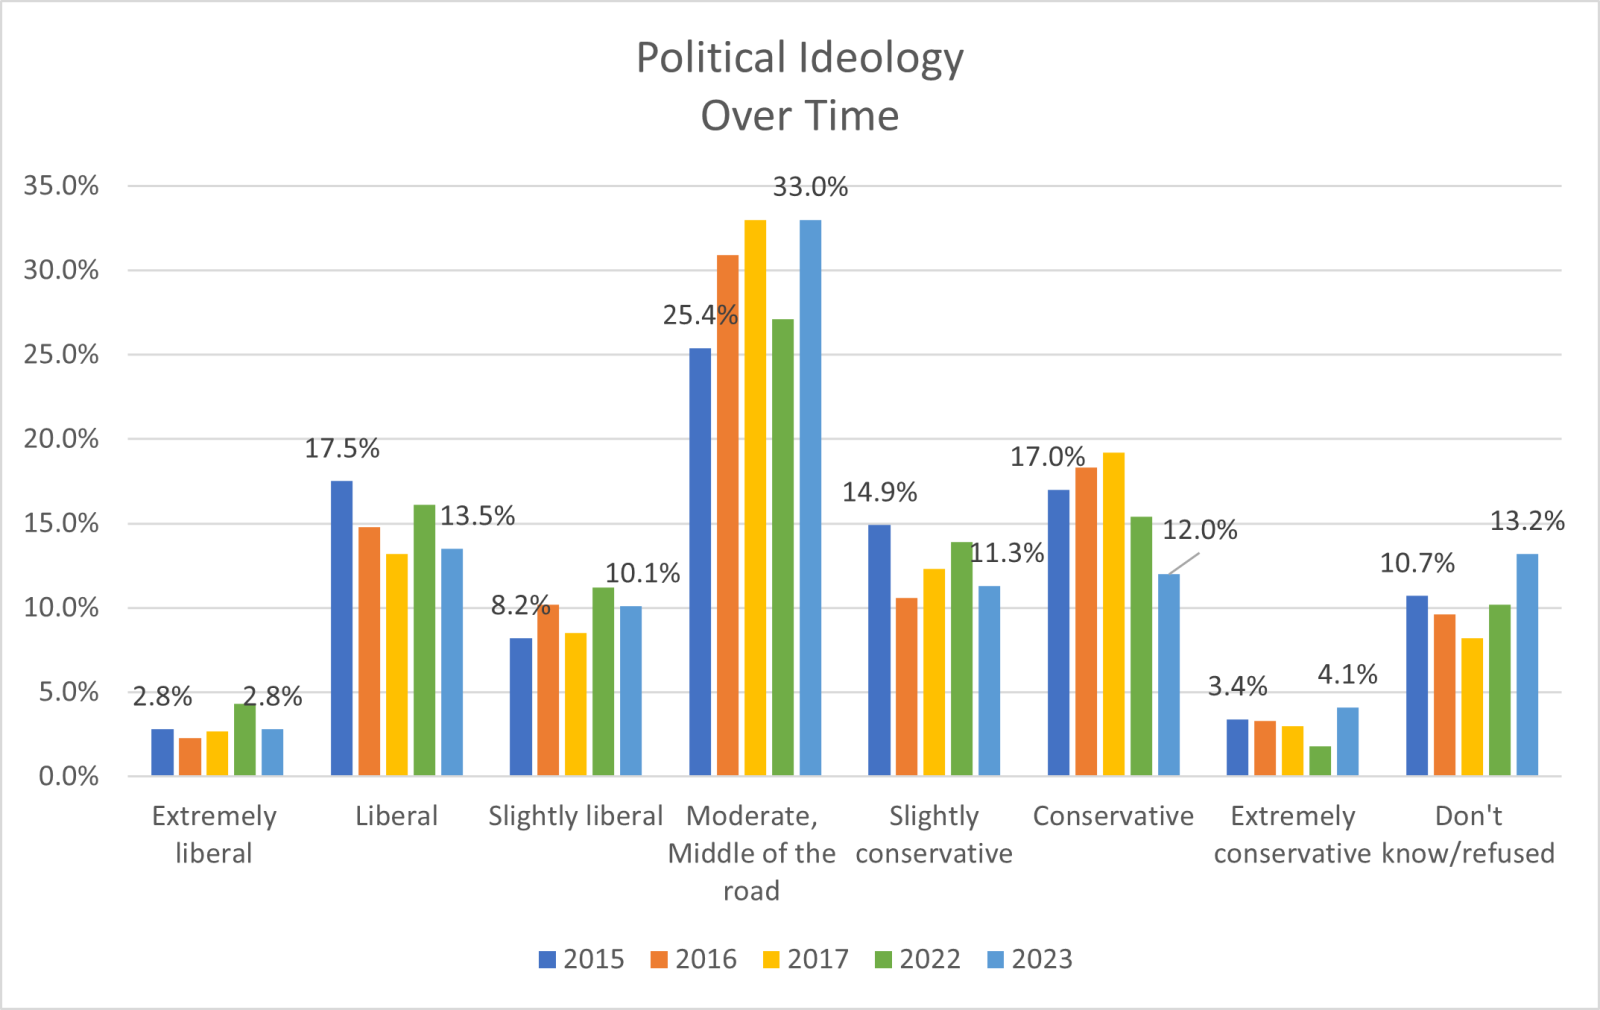
This year’s survey also asked about respondent self-rated political ideology. Individuals were asked to describe their political views on a seven-point scale ranging from extremely liberal to extremely conservative. This item suggests that the region is quite balanced ideologically, with nearly equal numbers of liberals and conservatives. The largest group of respondents was those who said they were moderate (33%). Overall, just over one-quarter of respondents (26.4%) described themselves as liberal (summing across the three liberal categories) which is down 5.2% from 2022, and slightly more than one-quarter of respondents (27.4%) described themselves as conservative, also down nearly 4% from 2022. This year the portion of respondents who either refused to state their ideology or indicated that they did not know increased somewhat to 13.2%. Overall, almost half of survey respondents (46.2%) did not see themselves as either liberal or conservative. The many moderate, non-ideological, non-partisan respondents reflect the diverse audiences that both parties will potentially need to attract to win in the November elections.
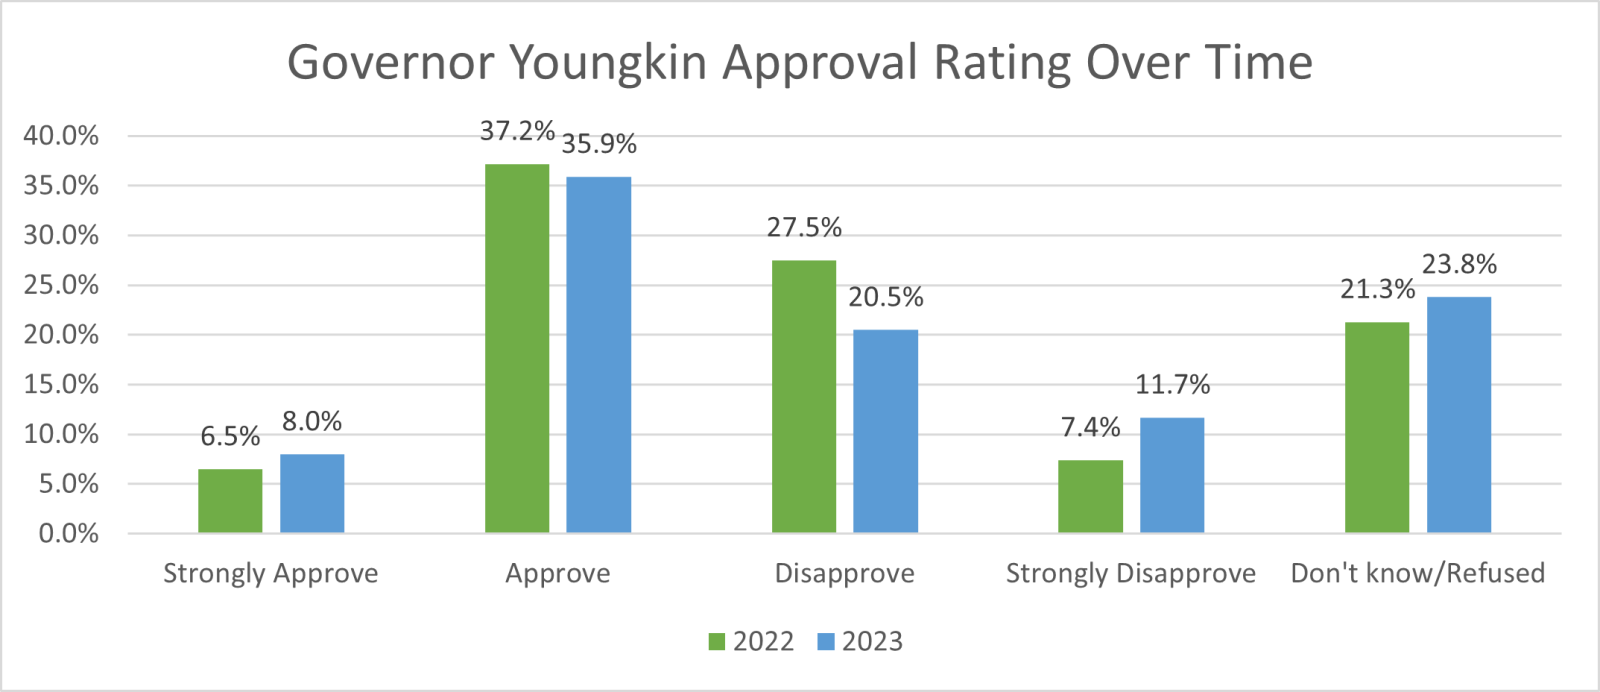
At the time that the survey was conducted, Glenn Youngkin was in his second year as governor. Opinion of the governor’s job performance remained mixed, with 43.9% approving or strongly approving and 32.2% disapproving or strongly disapproving. Nearly one in four respondents indicated that they either did not know or refused to answer (23.8%). Since Youngkin received roughly 45% of the vote in the November 2021 gubernatorial election within the seven cities surveyed (217,129 out of 479,886 votes), this level of approval seems consistent with neither major gains nor losses in popularity for the governor at this point in his administration. There has, however, been a modest hardening of opinion toward the governor since the 2022 survey, with more respondents (19.7% versus 13.9%) indicating that they held their views strongly compared to 2022.
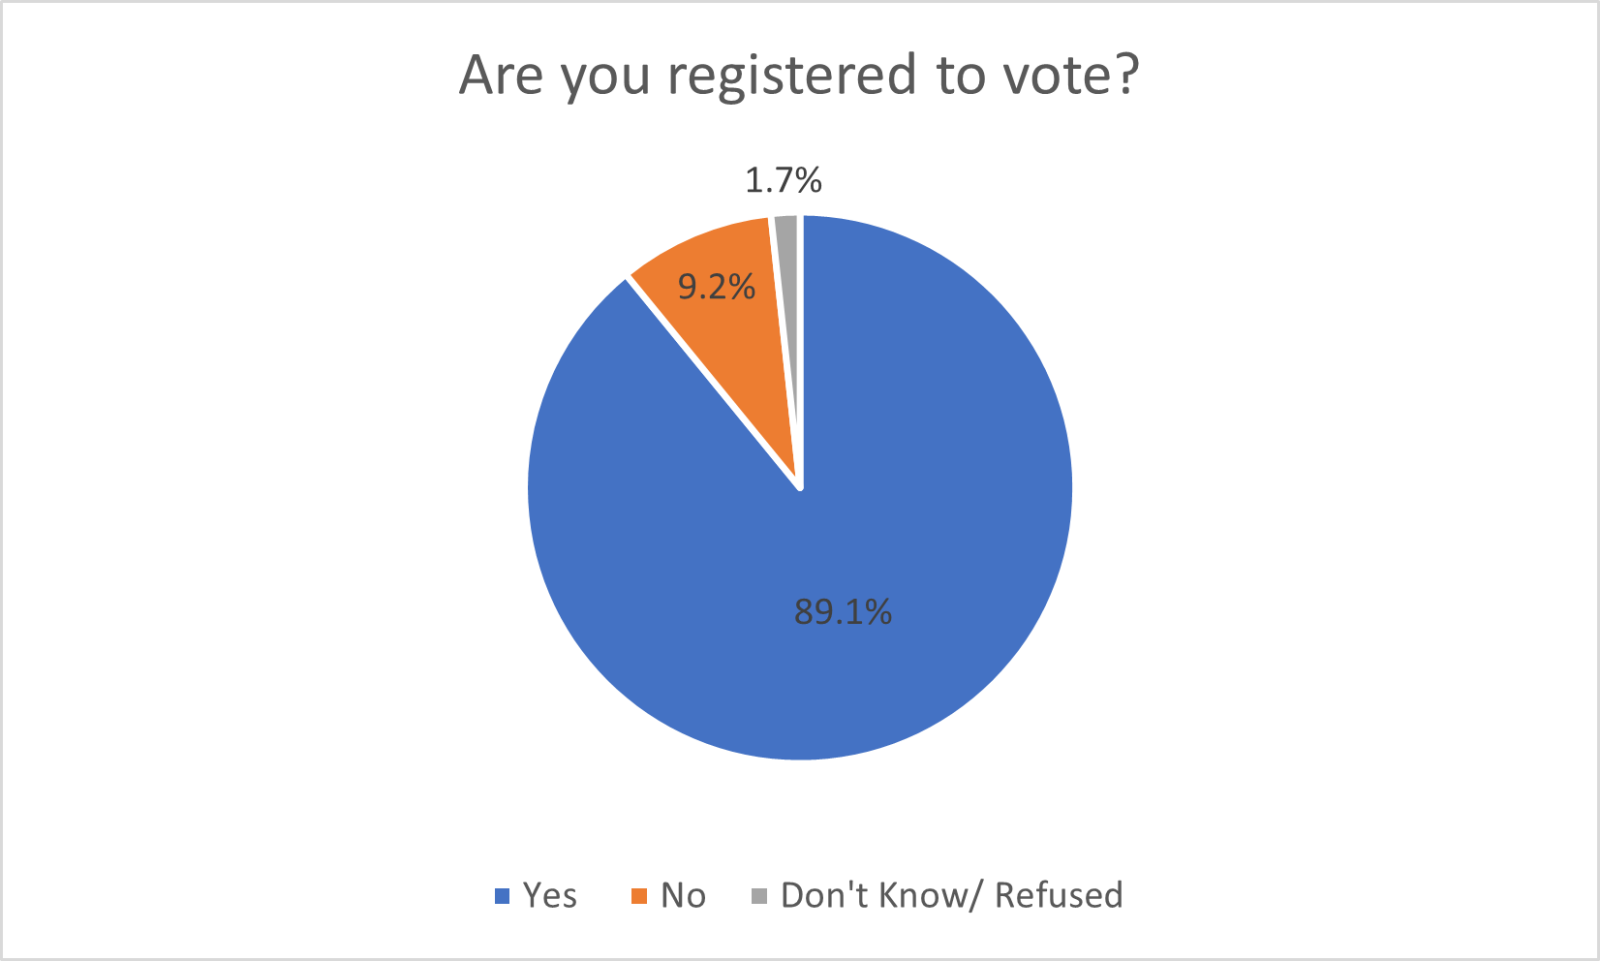
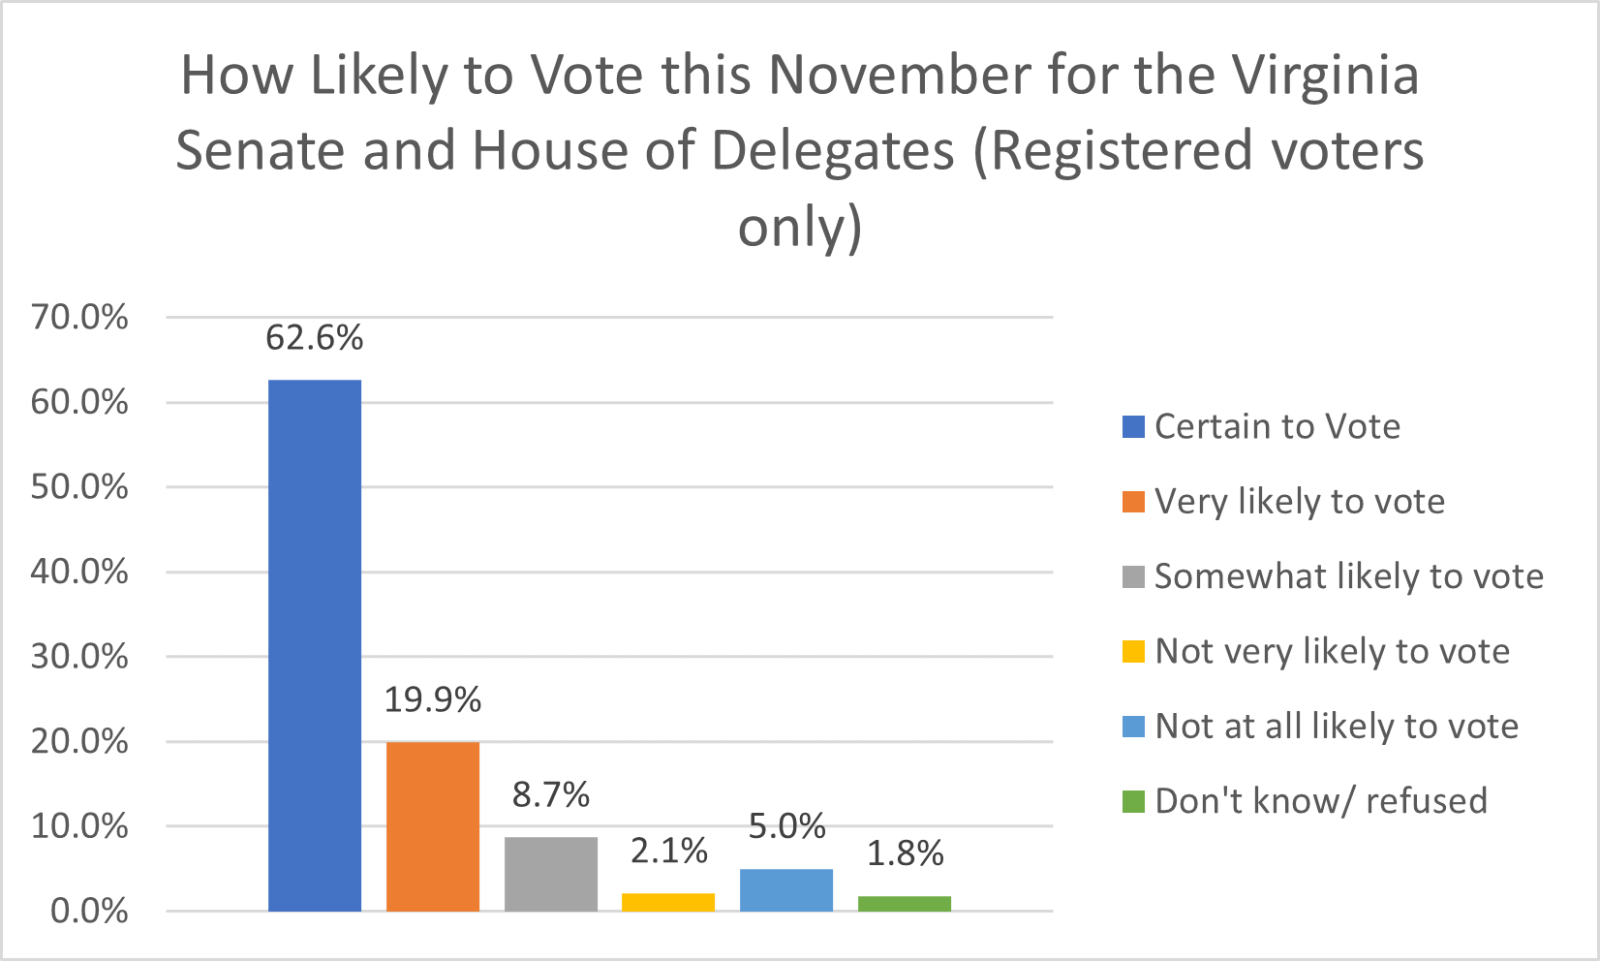
In November, Virginia held an election for all members of the House of Delegates and State Senate. Because of this, the Life in Hampton Roads Survey included several questions concerning the election. These questions included some issue priority questions, and questions concerning how respondents planned to vote. Most survey respondents (89.1%) indicated that they were registered to vote.
Among those who were registered voters, 62.6% indicated that they were “certain to vote,” with another 19.9% claiming that they were “very likely to vote” in the November election. Preliminary city-level voter turnout estimates from the Virginia Department of Elections indicate between 31% (Norfolk) and 50% (Virginia Beach) turnout among registered voters in the election. This suggests either that some people who thought they were certain to vote changed their mind, or that the sample contained a disproportionate number of registered voters who intended to turnout. This could perhaps be due to some of the registered voters who did not turn out being more difficult to reach by survey or recently moved from the area.
In the analyses below, some results are reported for the entire set of respondents, sometimes just those who were registered to vote, and sometimes only of likely voters, defined as respondents who indicated that they were at least “very likely to vote” and were also registered to vote. Many registered voters had yet to make up their mind about which candidate to support in the 2023 Virginia legislative election. This uncertainty may be multiplied by the major changes brought by redistricting – which resulted in many Hampton Roads residents in new districts with new candidates running. This year was the first year that Virginia’s legislature was elected using the new districts drawn by special masters hired by the Virginia Supreme Court after the redistricting commission deadlocked. For both the House of Delegates (29.1%) and Virginia Senate (27.6%), more than one quarter of respondents did not know what candidate they would vote for or refused to answer the question. These numbers were only marginally lower among likely voters (26.1% and 24.6%, respectively). Clearly, many respondents had yet to make up their minds at the time of the survey, and this could make a big difference in terms of the election outcomes if particular campaigns managed to attract the support of undecided voters.

Among likely voters who had made up their minds, however, Democrats had a striking advantage in the House of Delegates. Almost two-thirds (64.7%) indicated that they planned to vote for the Democratic candidate for the Virginia House of Delegates, whereas only 31.3% indicated that they planned to vote for the Republican candidate. By contrast, when the last election for these offices took place in 2021, voters from the seven Hampton Roads cities gave 45.8% of their votes to Republican candidates, and 53.7% to Democratic candidates. This suggested Republicans might have some significant ground to make up if they wanted to avoid Hampton Roads area House of Delegates seat losses in the November election.[1] This possibility was confirmed by the ultimate election results, in which Republicans lost control of the House of Delegates.
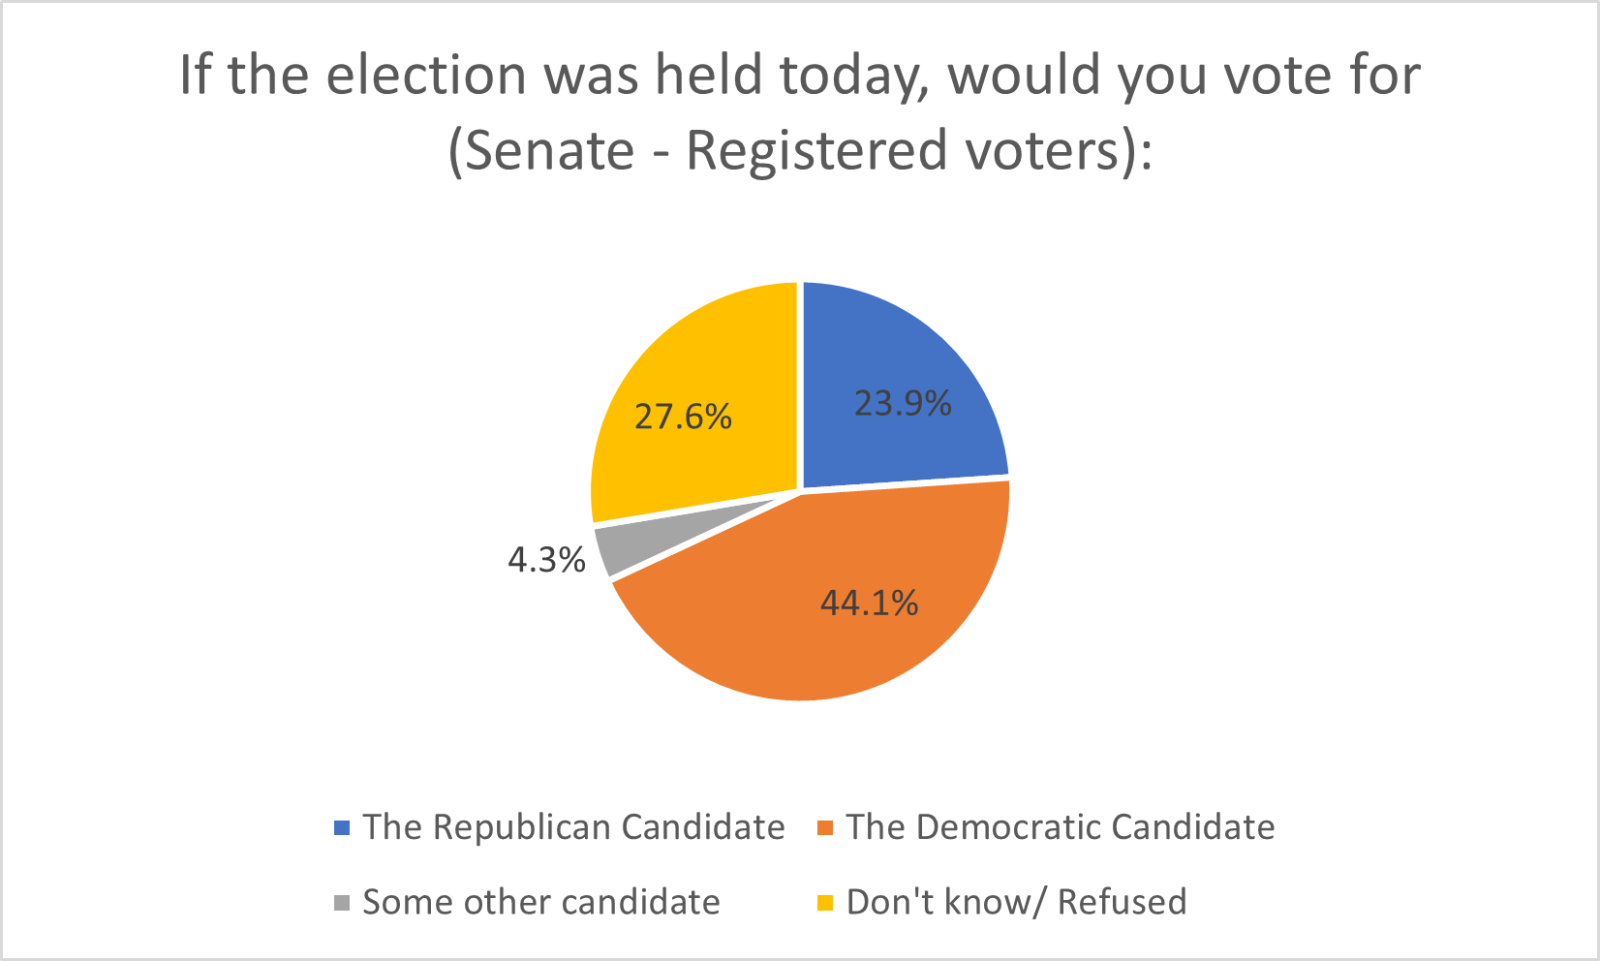
A similar pattern was observed for the Virginia Senate, although the political implications were somewhat distinct. Among likely voters who had made up their minds, 62.2% indicated that they would vote for the Democratic candidate if the election was held today, compared to 32.9% who supported the Republican candidate.[2] The most recent election for Virginia’s Senate occurred in 2019, a year that was favorable for Democrats, and several seats were not even contested by Republicans in that cycle. Democrats won 64.2% of votes cast in the Hampton Roads seven cities during the 2019 Senate contests, compared to only 30.8% for the Republicans. Thus, in contrast with the House of Delegates races, the results for the Virginia Senate offered some modest encouragement for Republicans concerning their prospects in that chamber as the polling placed Republicans modestly ahead of their 2019 performance. Ultimately, Republicans did gain one seat statewide in the Virginia Senate, although this was not enough to give the party control of the chamber. The key Republican seat pick-up occurred in Hampton Roads’ 24th District where Democrat T. Monty Mason was the only Senate incumbent who ran for re-election and lost.
Taken together, the results of the survey suggested that Republicans would struggle to maintain their advantage in the House of Delegates which dated from a year where the strong performance of the Youngkin campaign in Hampton Roads helped boost Republican chances in the House of Delegates, but that Democrats potentially faced some challenges maintaining their advantages in the Virginia Senate which dated from the last Senate election in 2019 – a good election cycle for Democrats. For candidates from both parties, a major challenge was to win over the substantial share of the electorate that is still undecided, and given the low turnout overall in this election, it appears that to a significant degree both parties failed at that task. An important caveat is that this analysis looks across the seven cities in Hampton Roads as a whole and does not break the vote totals out by district. Future analyses might focus on estimating candidate performance in the new state legislative districts.
[1] Unweighted responses were somewhat more favorable for the Republicans. In the unweighted data, among likely voters who indicated a candidate preference, 58.4% supported the Democratic candidate, and 37.1% supported the Republican candidate for the House of Delegates. It is possible that the weighting process could have distorted the Republican vote totals, particularly as (to retain consistency with past years) LIHR is not weighted based on education, and failure to weight on education sometimes leads to inaccuracies in favor of Democrats in polls.
[2] As for the House of Delegates, unweighted responses were somewhat more favorable for the Republicans. In the unweighted likely voter sample, 58.4% indicated that they would vote for a Democrat if the election was held today, and 37.1% indicated that they would vote for a Republican.
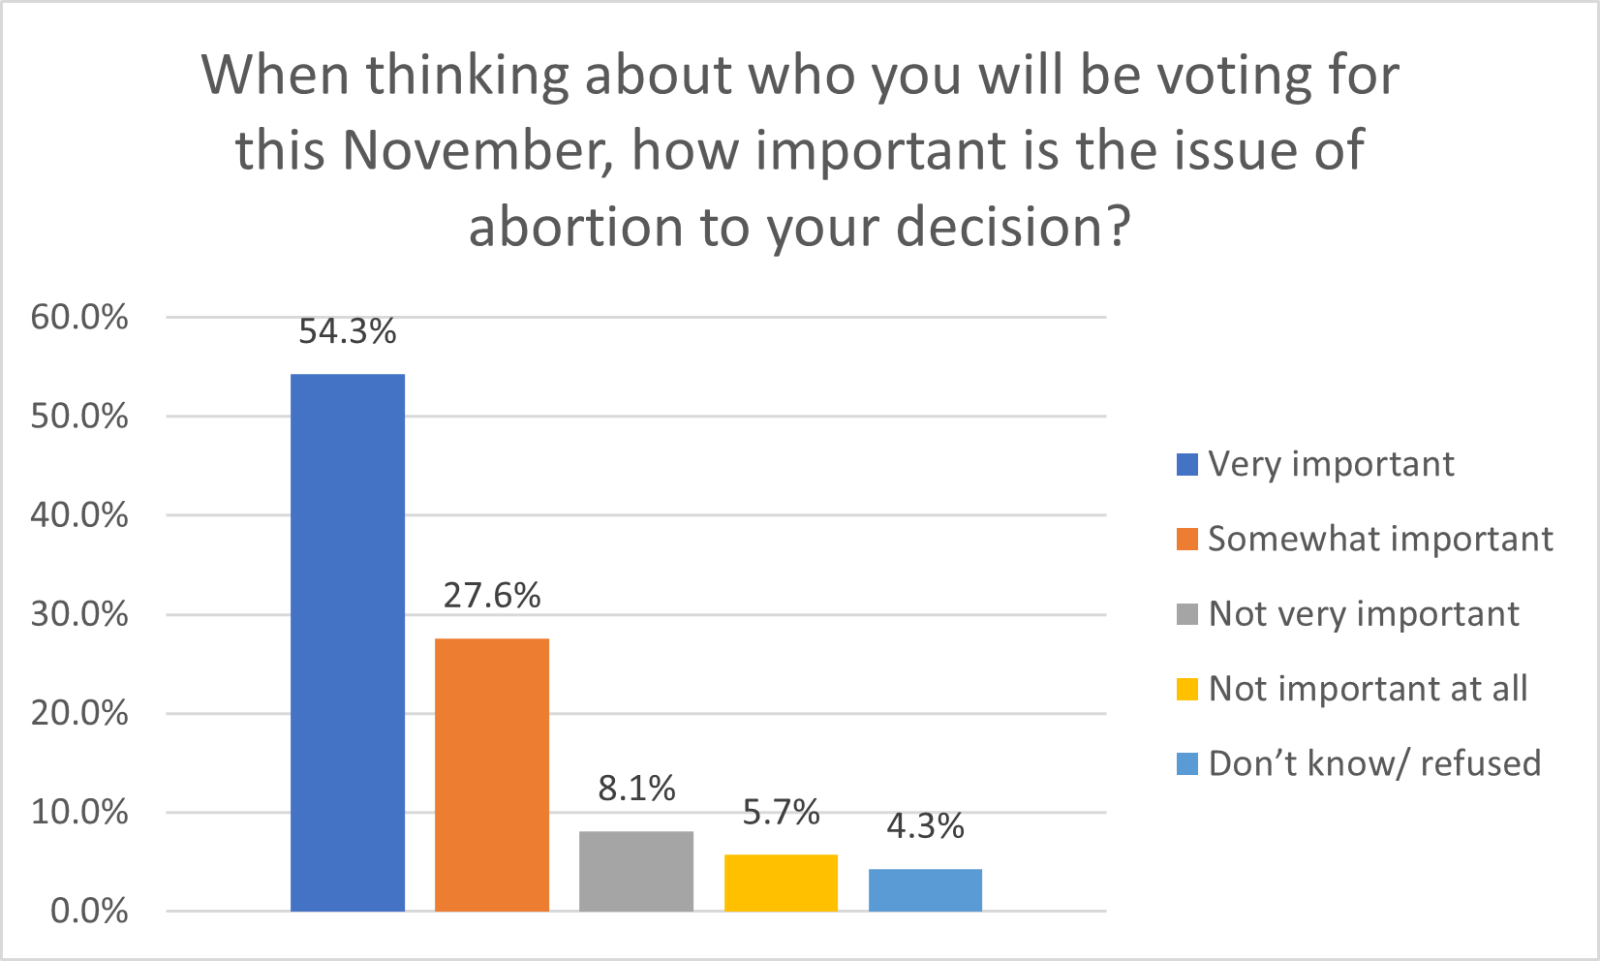
What issues are moving voters? The survey included a set of questions about the importance of the issue of abortion. After the United States Supreme Court overturned the Roe v. Wade decision in 2022, abortion became a much more salient issue in the subsequent Congressional midterm elections. The survey asked about abortion to assess whether and to what extent this intensity on the abortion issue continued into 2023. When asked “how important is the issue of abortion to your decision” in the election, more than half of respondents (54.3%) indicated that it was “very important,” and more than a quarter indicated that it was somewhat important (27.6%). Overall, 81.9% of respondents indicated that abortion would be at least “somewhat important” for their decision.
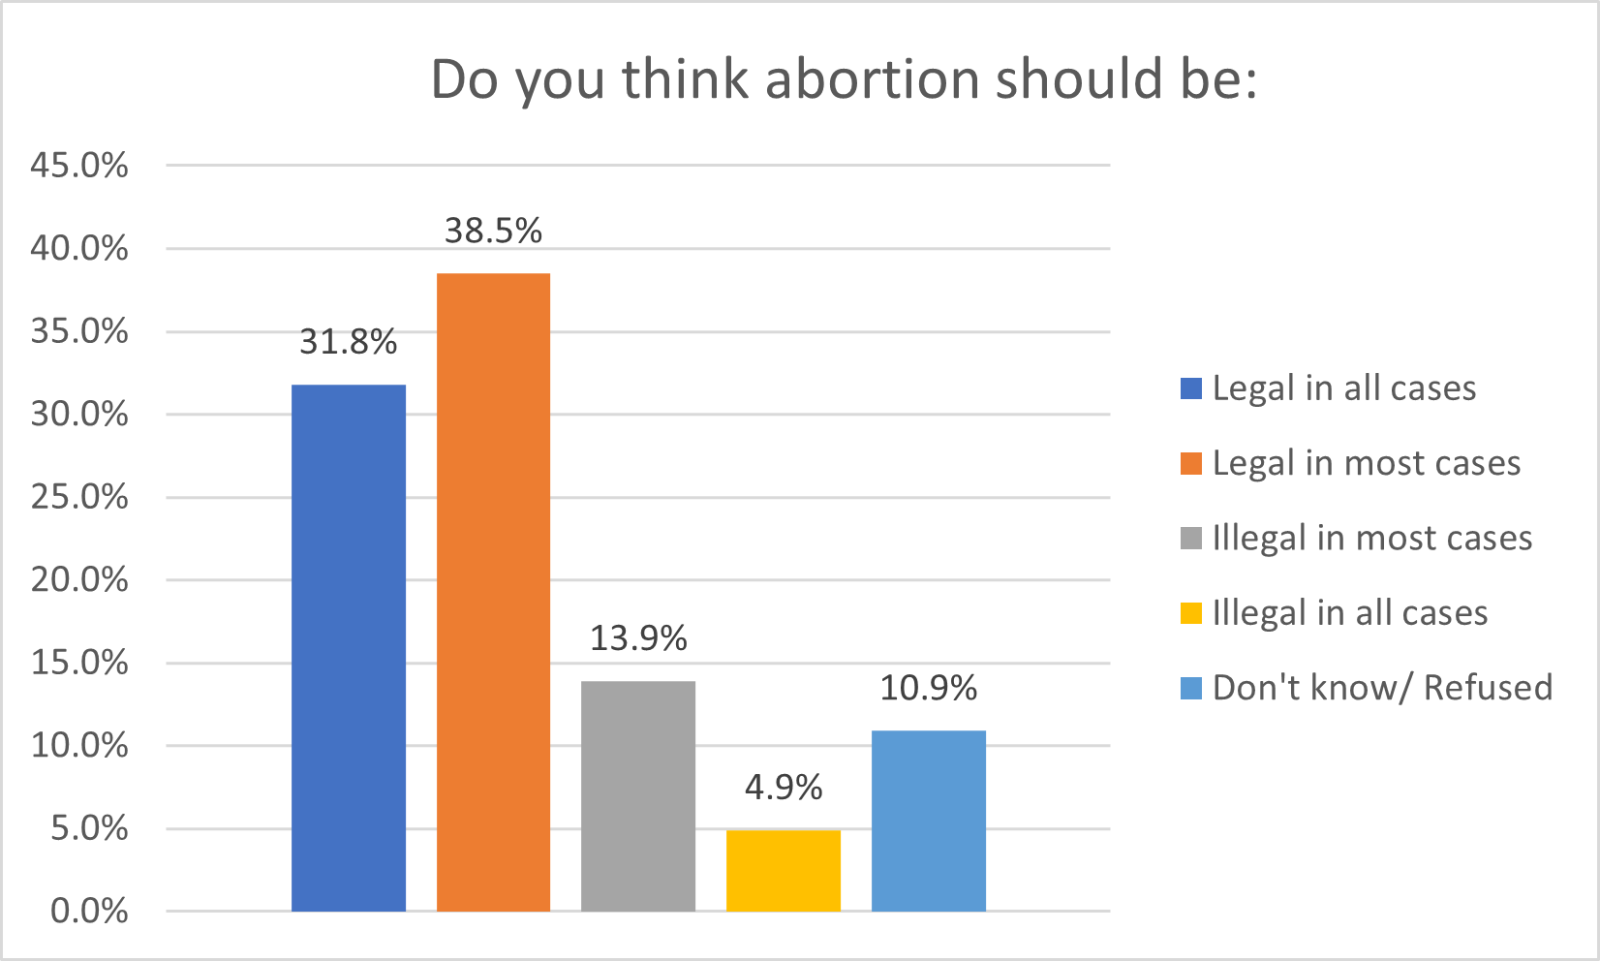
The political implications obviously depend upon voters’ views concerning abortion policy. Nearly one-third of respondents (31.8%) indicated that they thought that abortion should be legal in all cases, with the largest share of respondents (38.5%) indicating that it should be legal in most cases. Only 4.9% indicated that they thought abortion should be illegal in all cases.
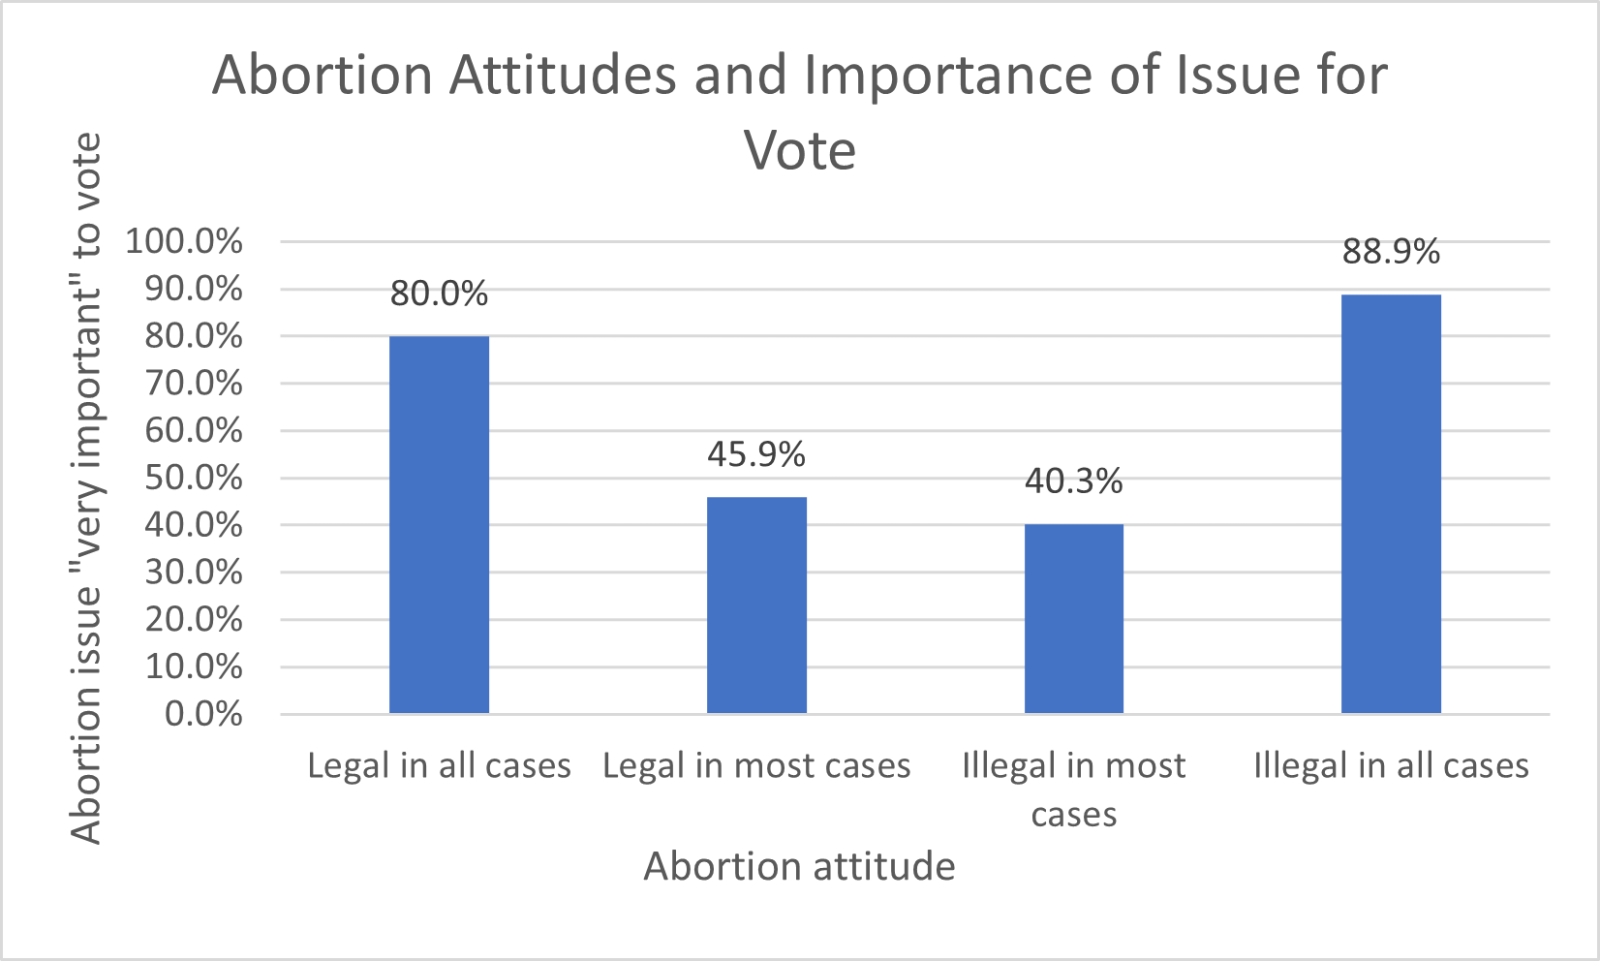
There was a statistically significant relationship (p<0.05) between abortion attitude and the importance of abortion for the vote, with a “very important” for the vote response most likely among respondents who thought abortion should be legal in all cases (80.0%) and illegal in all cases (88.9%). Even among respondents with more moderate positions on abortion, the issue was seen as very important for the vote by more than 40% of respondents.
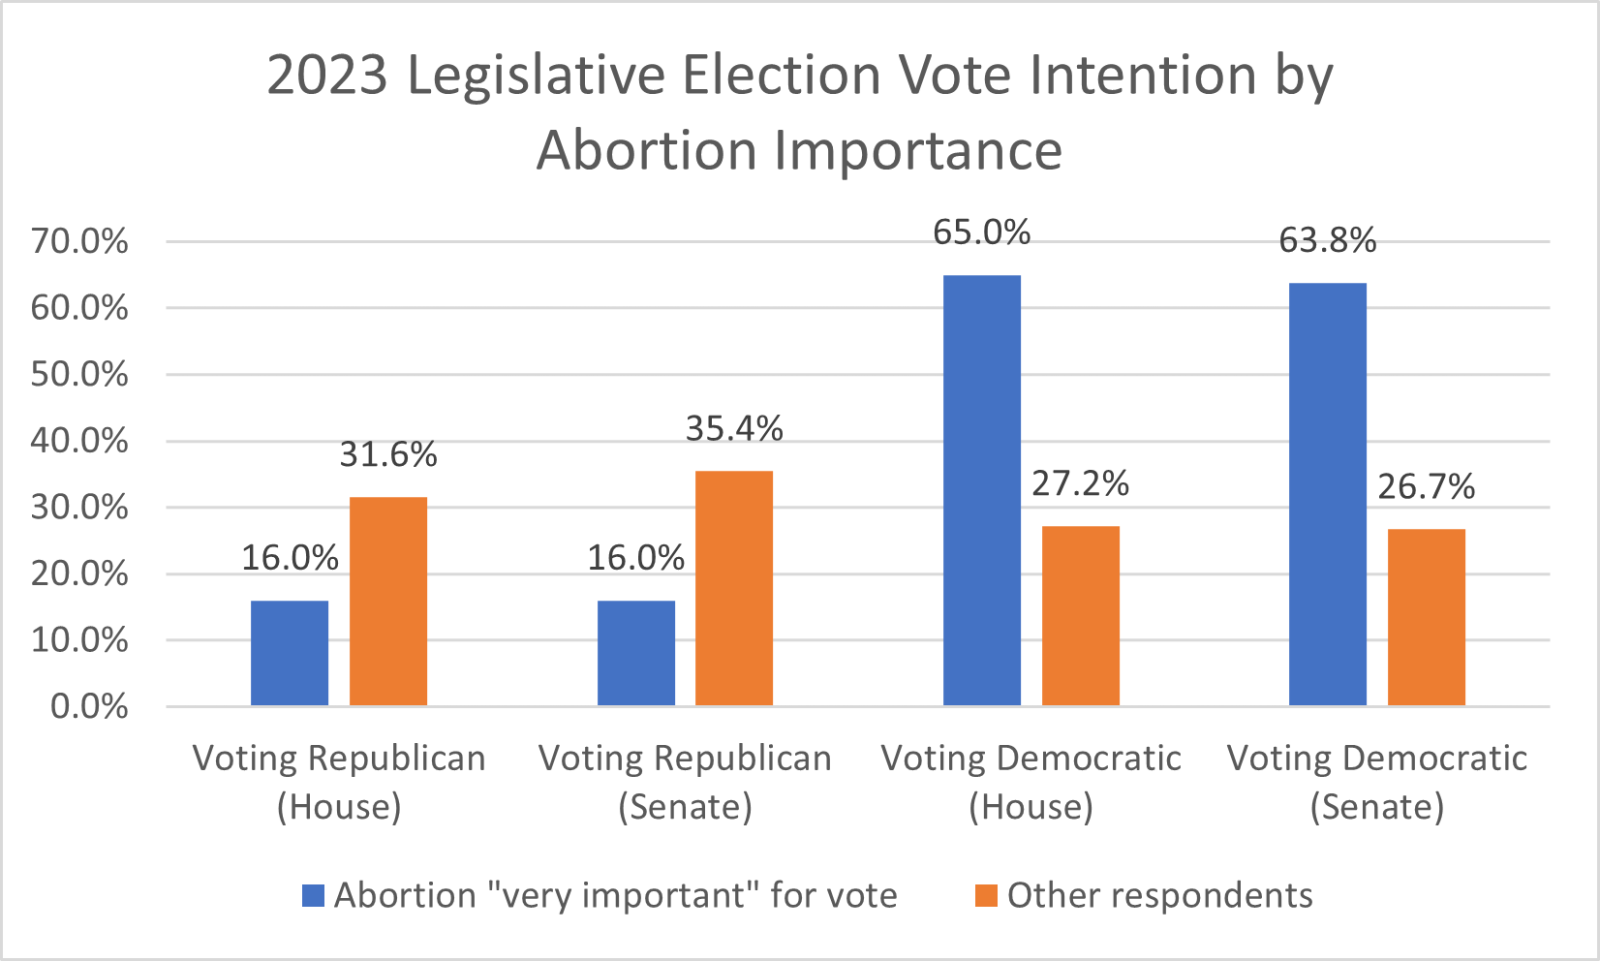
Among likely voters, Democrats thought abortion was a “very important” issue. About two-thirds (65.0%) of such respondents indicated that they would vote for the Democratic candidate for the Virginia House of Delegates and 63.8% indicated that they would vote for the Democratic candidate for the Virginia Senate. In 2022, Democrats performed relatively well in the midterm Congressional elections by emphasizing the abortion issue. These results suggest that the abortion issue continues to advantage Democrats in Hampton Roads.
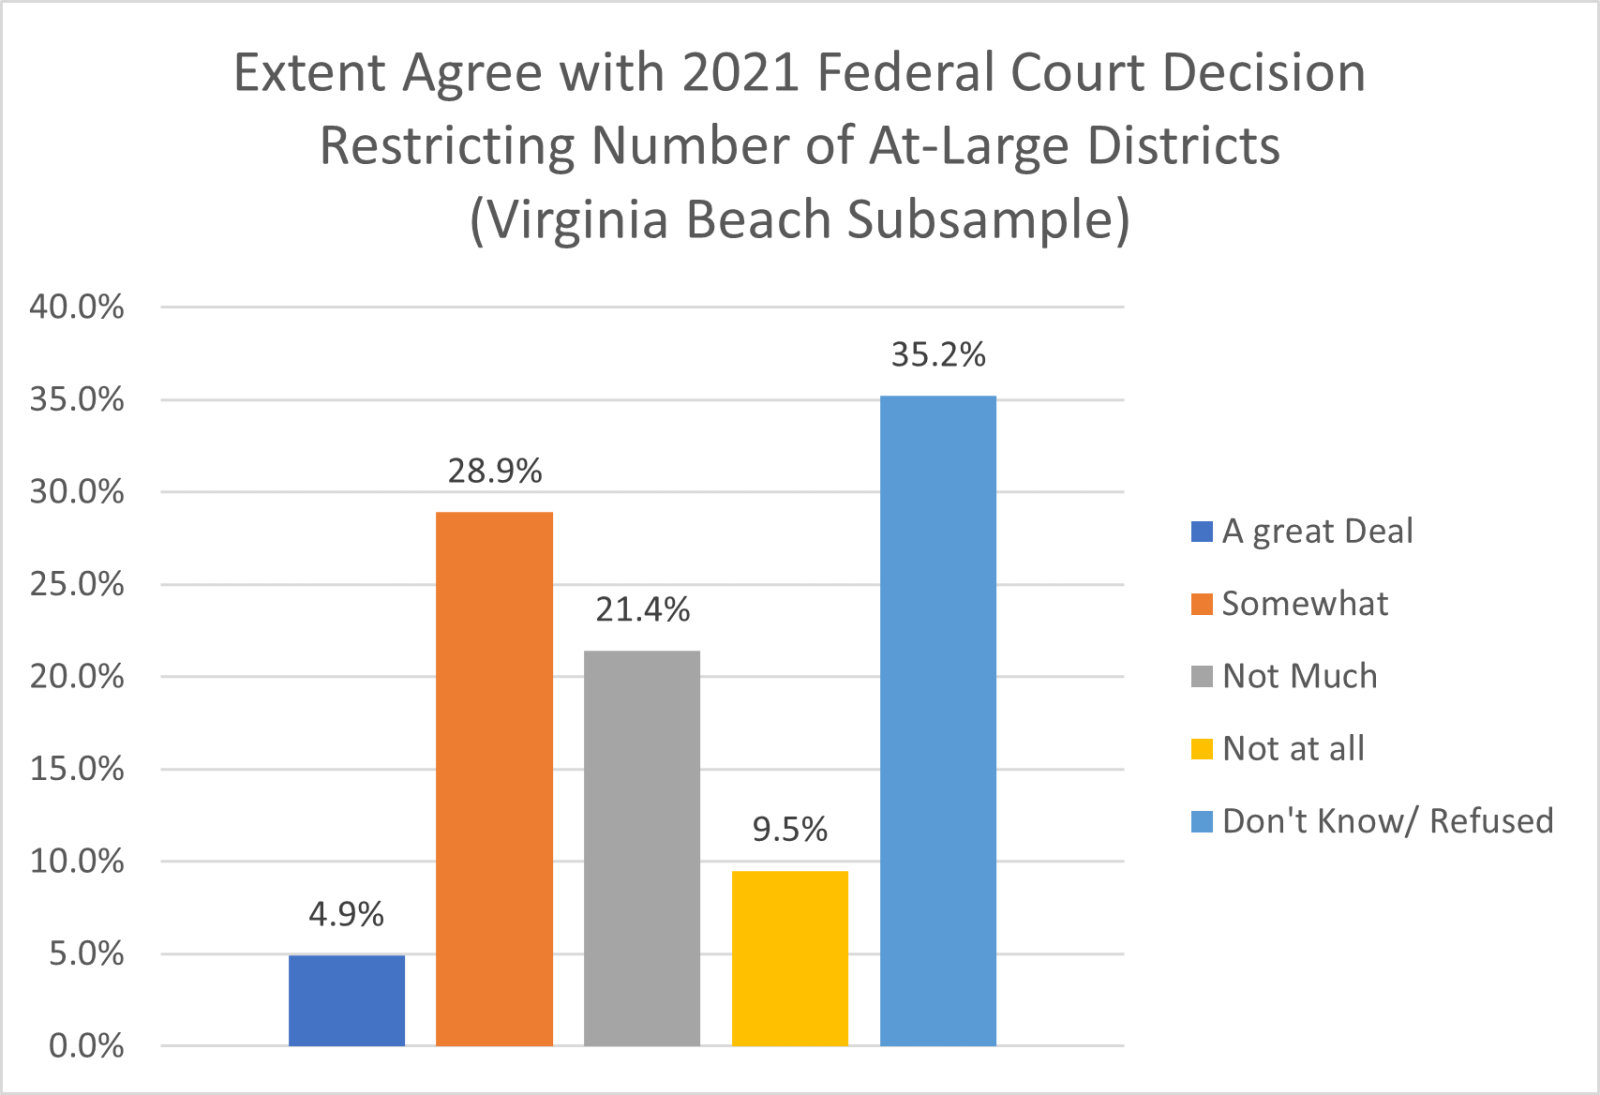
Virginia Beach residents (n=191) were also asked their views on the 2021 decision by a federal judge which restricted the number of at-large city council seats in Virginia Beach. Very few respondents said that they agreed “a great deal” with the ruling (4.9%) and the remainder of the respondents were split relatively equally between somewhat (28.9%), not much/not at all (30.9%) and don’t know/refused (35.2%).