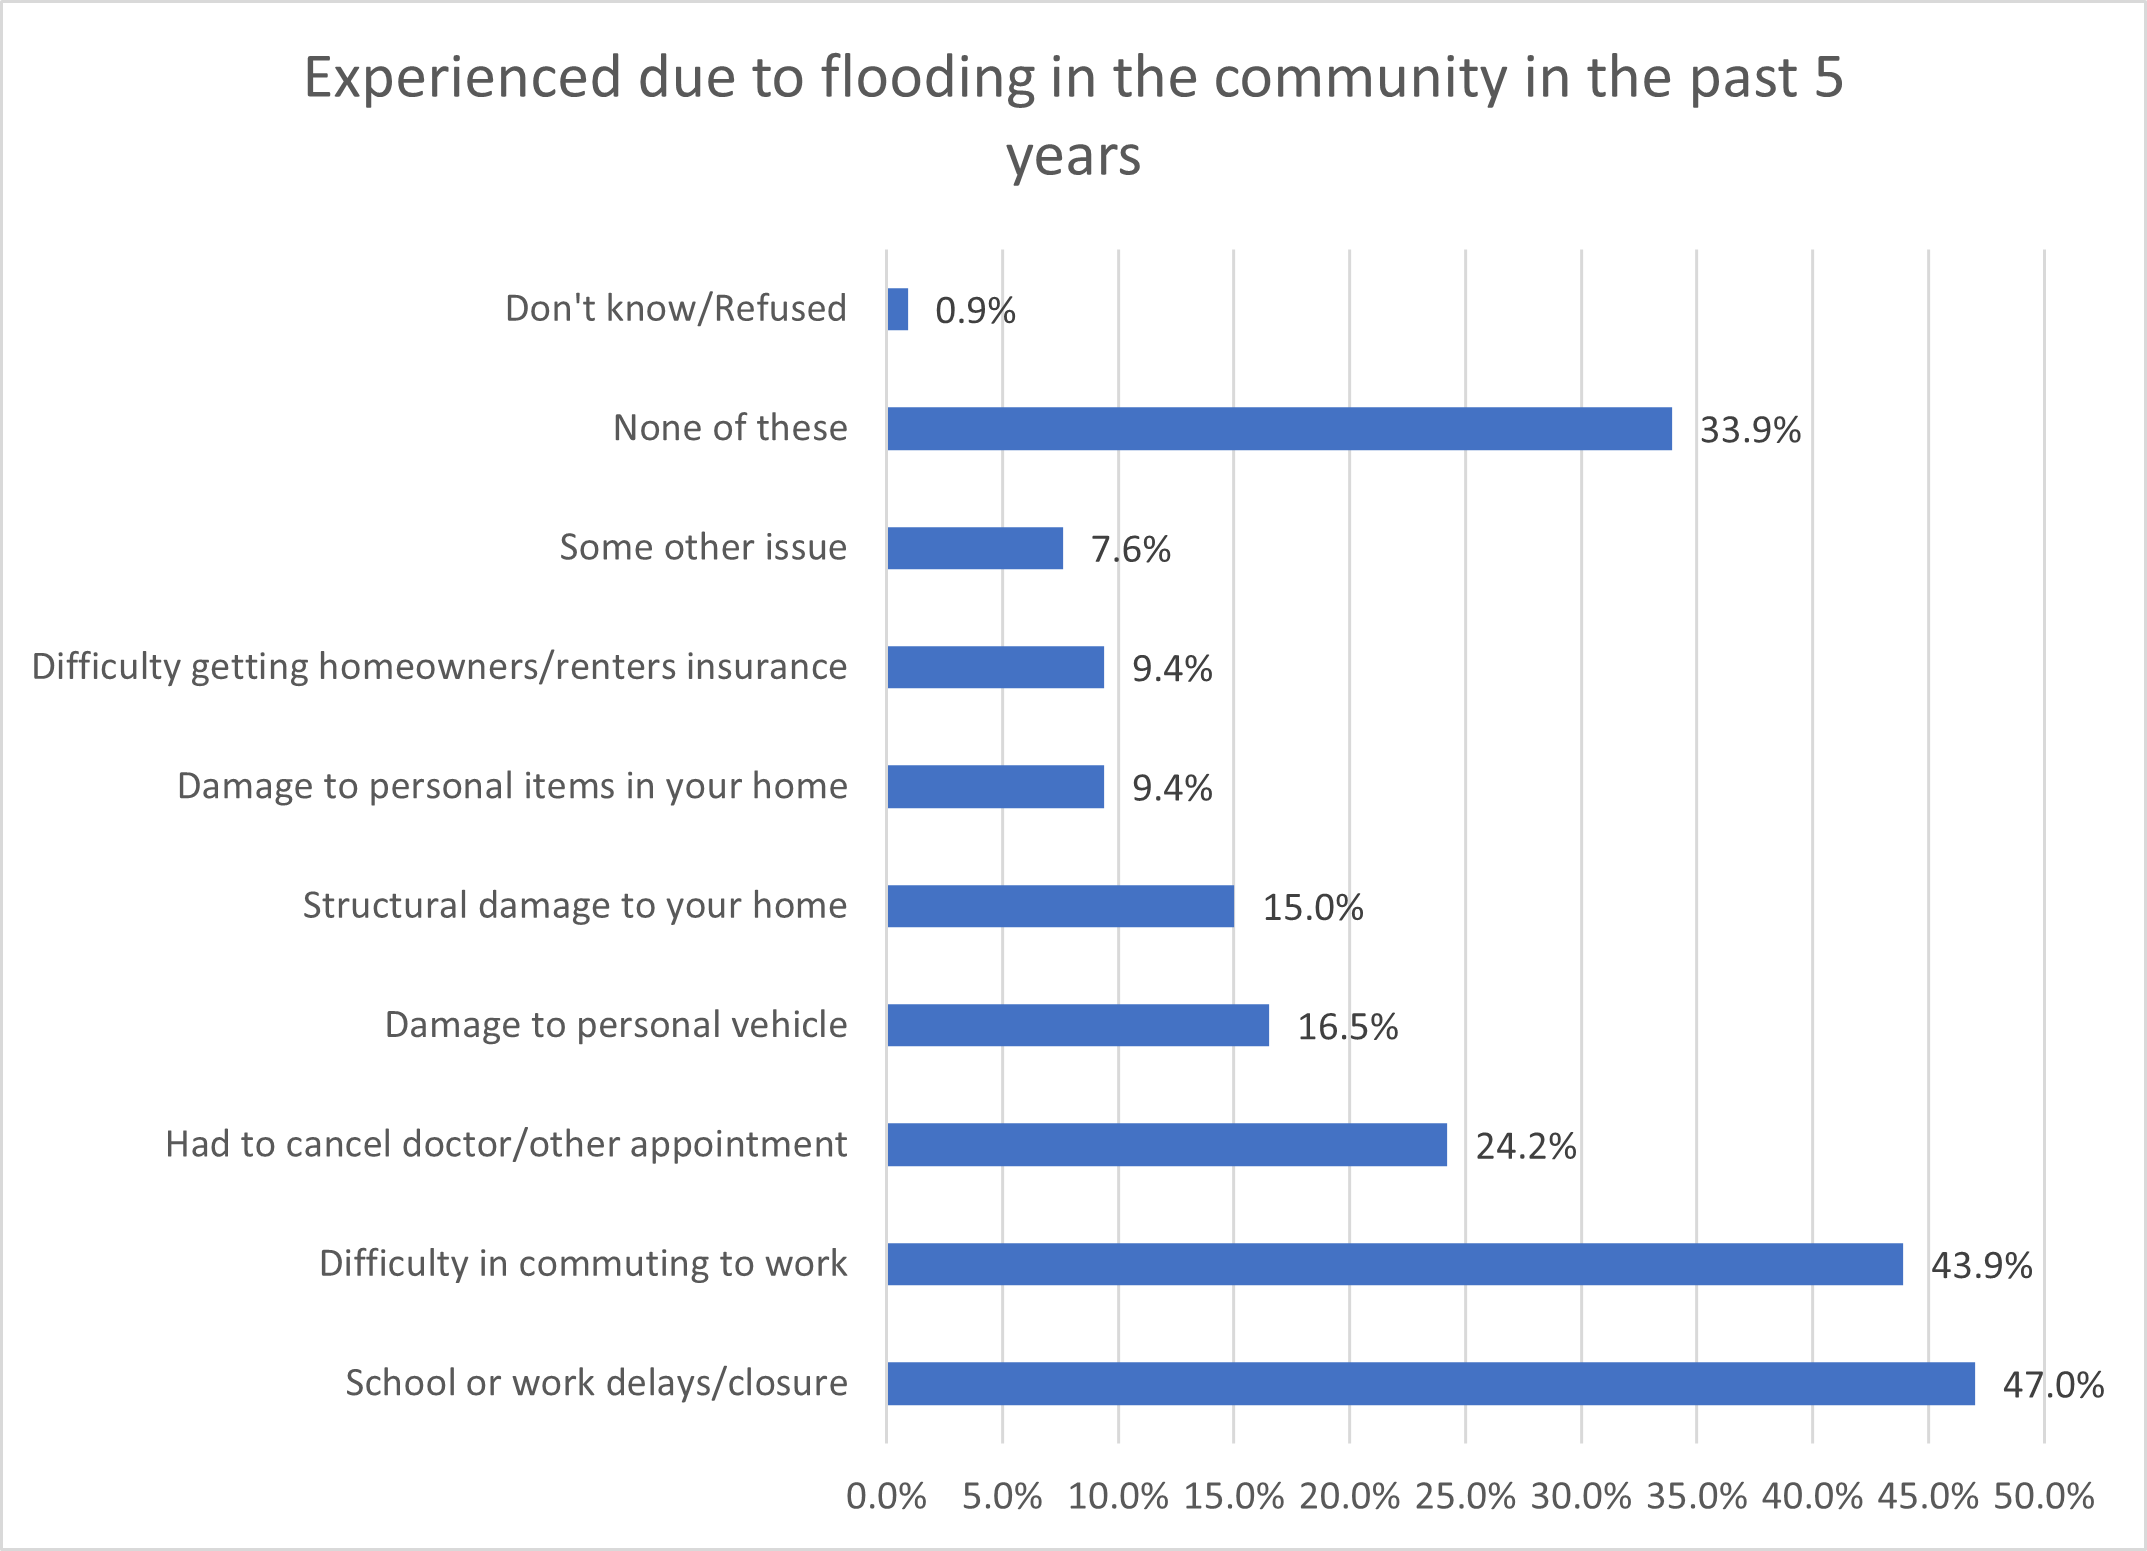
The coastal cities of Hampton Roads are particularly vulnerable to recurrent flooding, storm surge, and nuisance or “sunny day” flooding which impacts the lives and daily routines of residents. Respondents were asked to indicate what types of events they have experienced due to flooding in their community in the past five years. About one-third indicated that they had not experienced any events due to flooding. However, 47% indicated that they had experienced school or work delays/closures and 43.9% indicated that they have had difficulty commuting to work. About one in five respondents (24.2%) indicated that they had to cancel doctor or other appointments due to flooding. More than 16% of respondents have experienced damage to a personal vehicle and 15% reported structural damage to their home. Less than 10% of respondents reported damage to personal items in their home or difficulty getting homeowner/renter’s insurance.
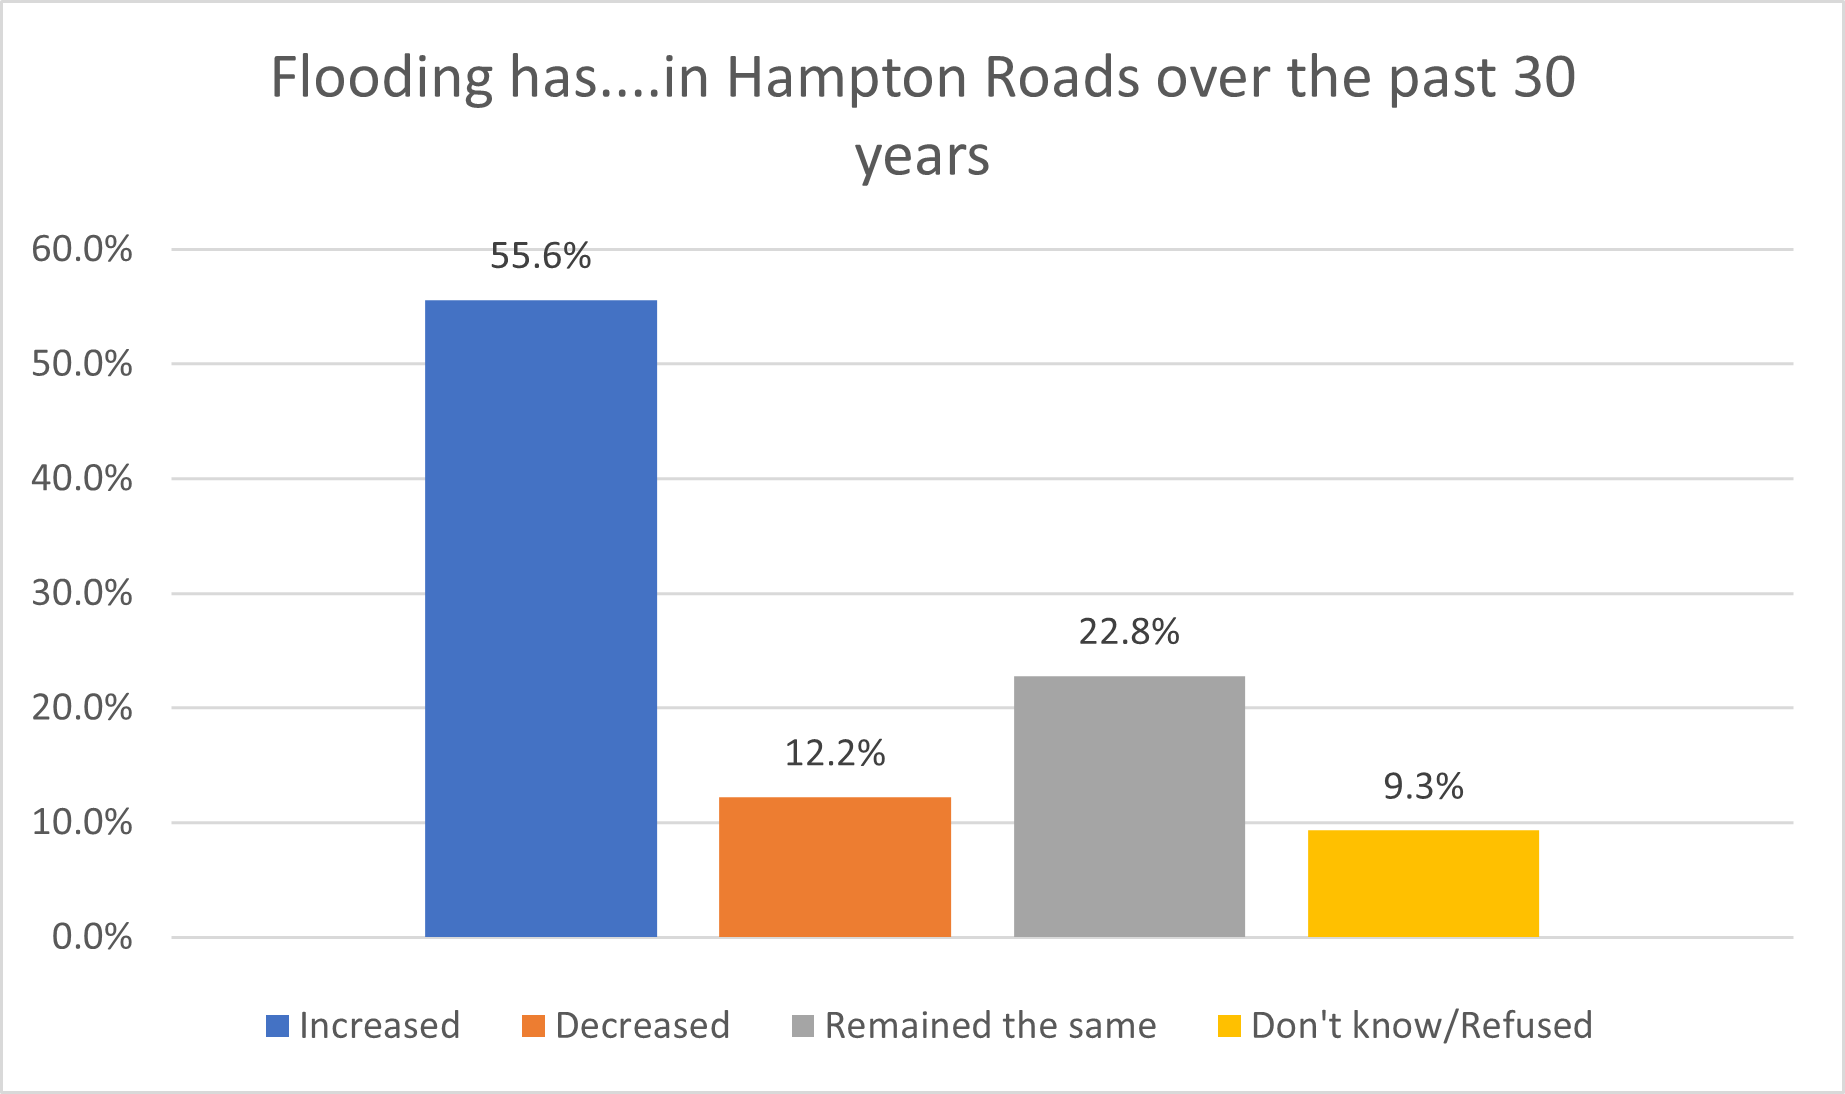
Respondents were also asked if they thought flooding has increased, decreased or remained the same in Hampton Roads over the past 30 years. More than half (55.6%) felt that flooding has increased while more than one-third believe that flooding has either decreased (12.2%) or remained the same (22.8%).
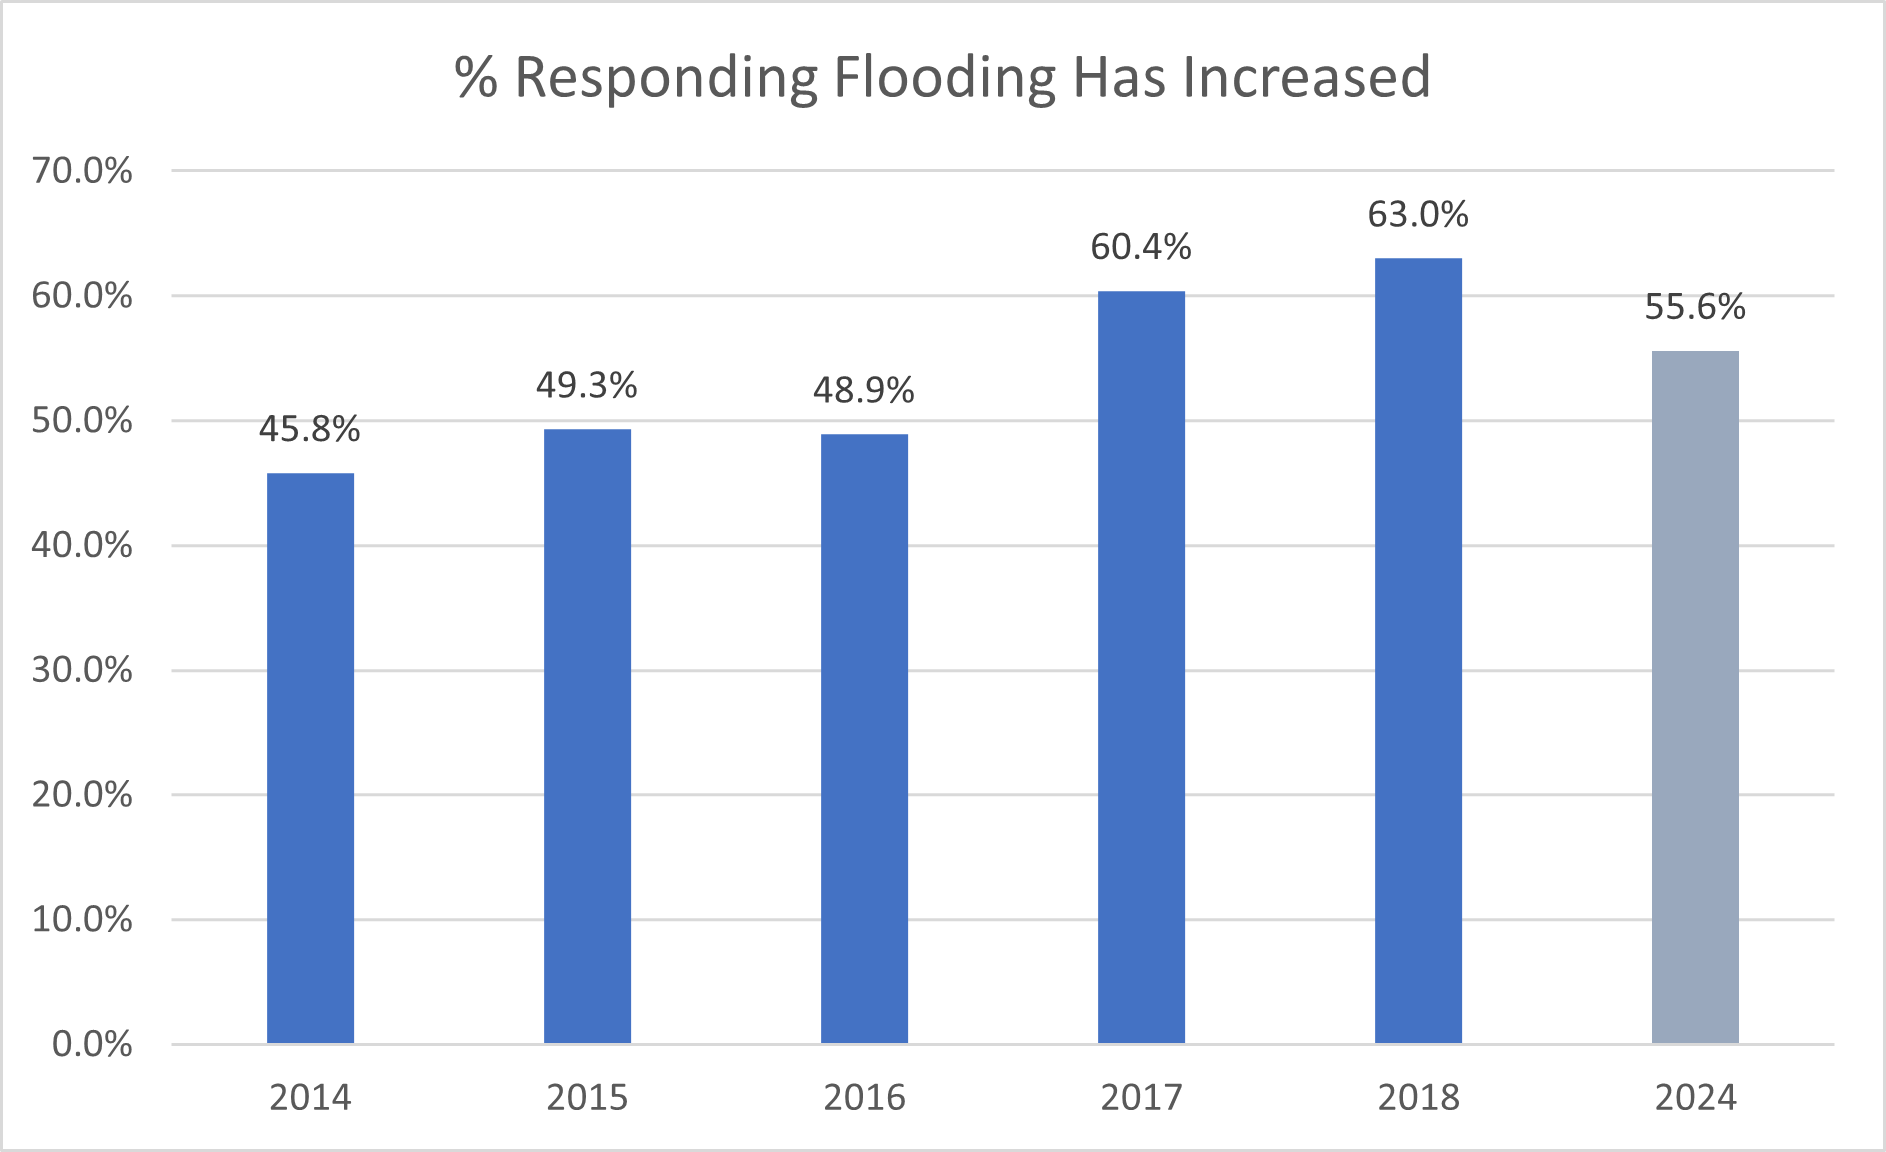
Perceptions of flooding have shown some variability over time in Hampton Roads. Respondents in 2014-2018 were previously asked the same question as to whether flooding has increased, decreased or remained the same in Hampton Roads over the past 30 years. There has generally been an upward trend since 2016 in the percentage of respondents who believe flooding has increased in the region. The years with the highest percentage of “increasing” responses were in 2017 and 2018 which are also among the top 10 wettest months of May on record10 (data collection for the Life in Hampton Roads survey typically begins in late May/early June). Hampton Roads also experienced Tropical Storm Hermine and Hurricane Matthew in the late summer/early fall of 2016 (the year prior). These events may have affected perceptions of flooding in the region.
10 See: https://www.weather.gov/media/akq/climateRECORDS/ORF_PRECIP.pdf


